EU ETS dashboard
The EU ETS dashboard is the single source for understanding your EUA bill. It shows the rules that apply this year, the voyages that are in scope, and a leg-by-leg breakdown of covered CO₂.
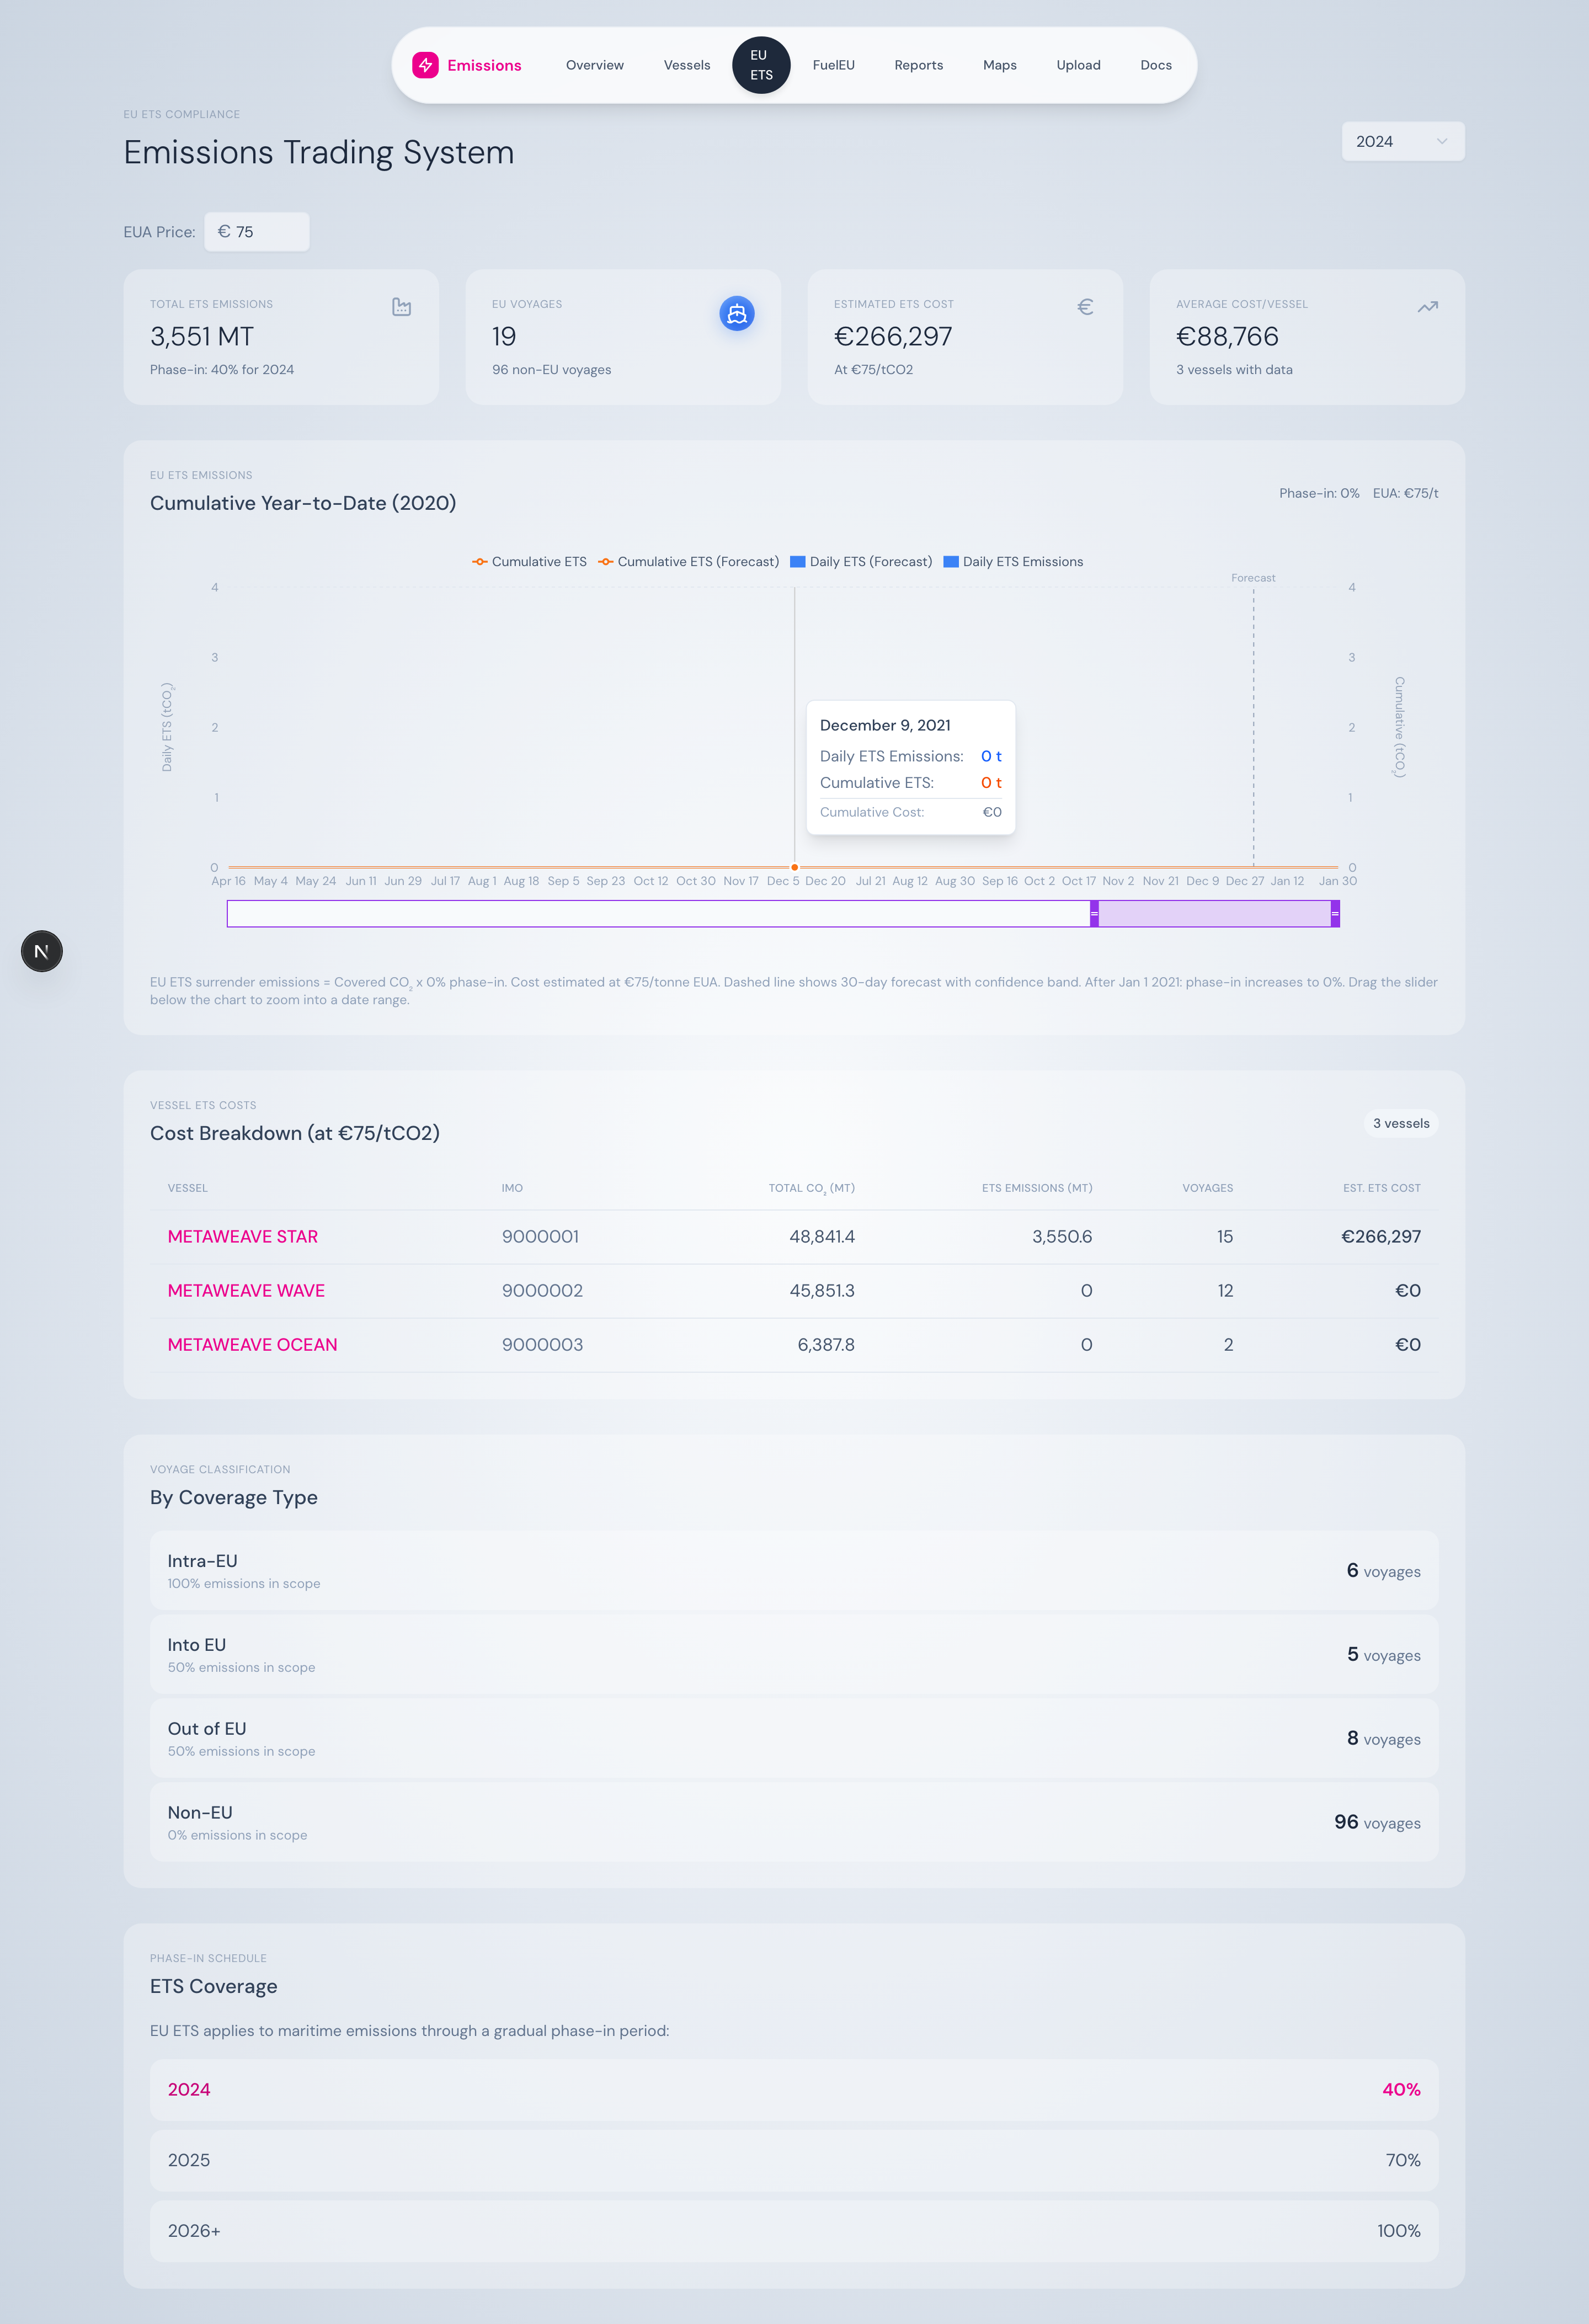
EU ETS dashboard hero — phase-in banner and summary cards.
What’s on the page
Phase-in banner
A static informational banner explains how EU ETS is phased into shipping, with the current year highlighted:
- 2024: 40%
- 2025: 70%
- 2026 onwards: 100%
Summary cards
Four cards across the top:
- Total Emissions in scope (tonnes)
- Vessels with data
- Total voyages in ETS scope
- Phase-in factor for the selected year
ETS cost visualisation
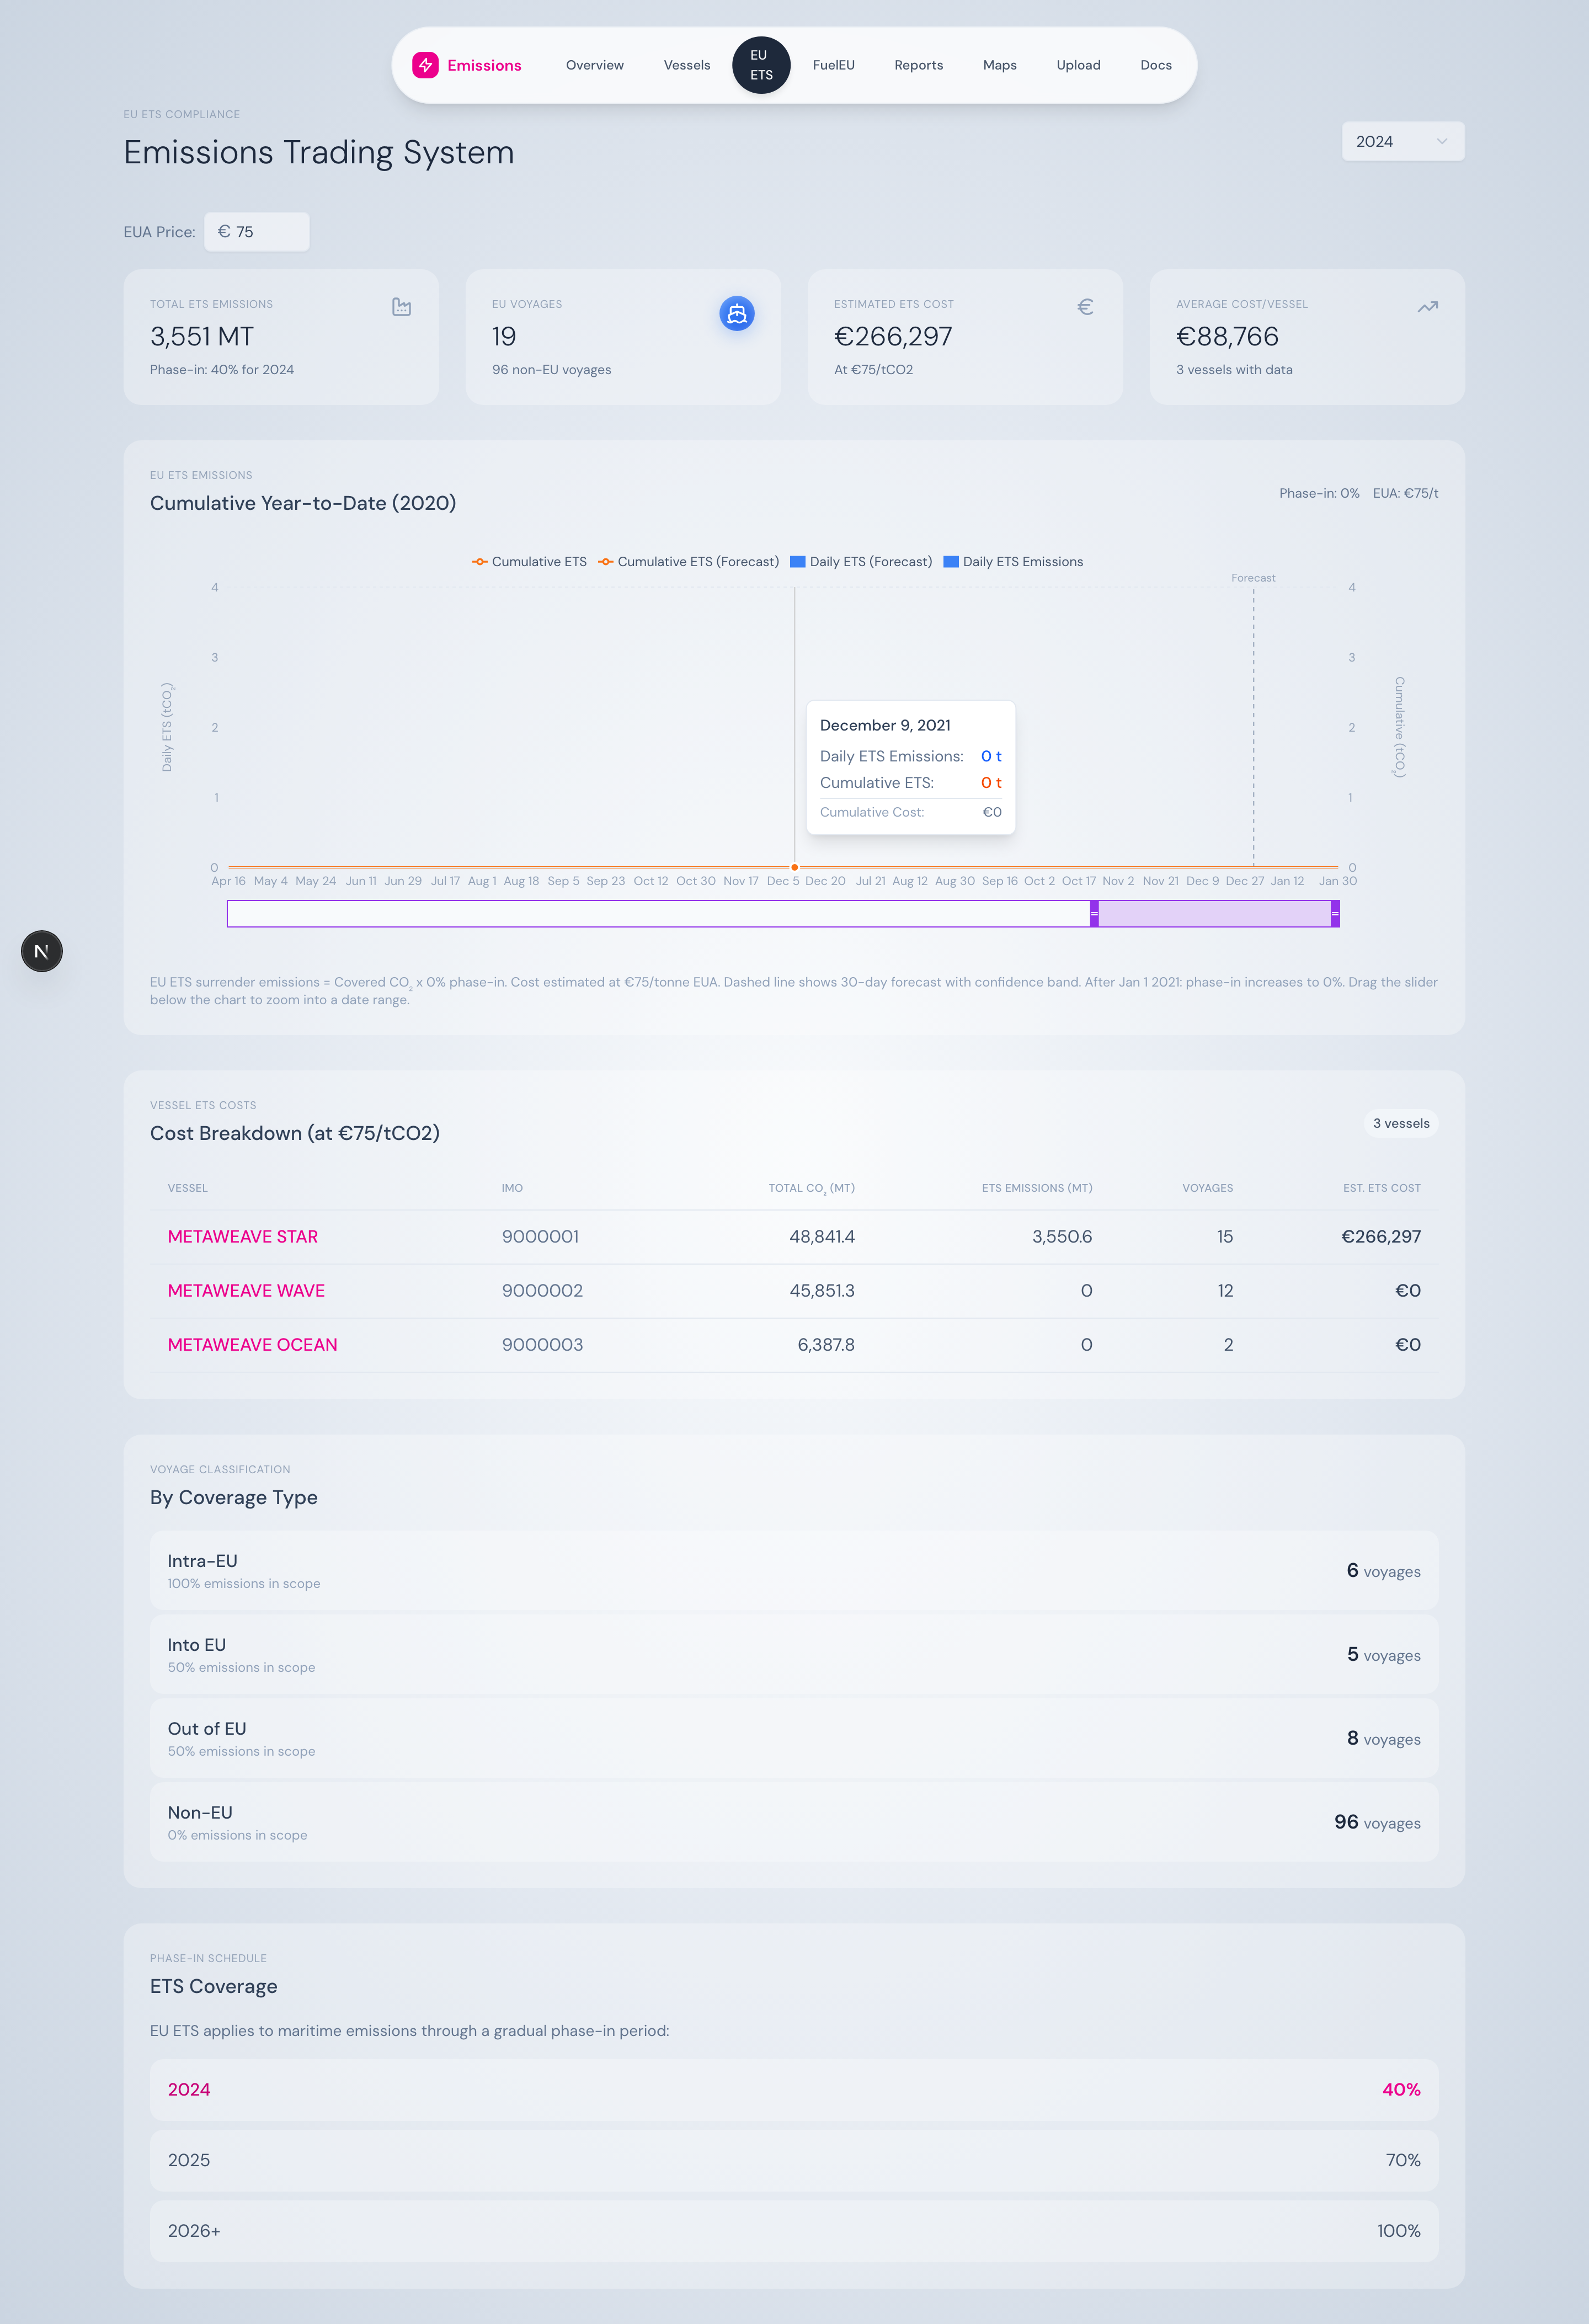
ETS cost breakdown by voyage type — interactive chart.
A chart breaks the cost down by voyage classification so you can see where most of the bill comes from.
Voyage classification
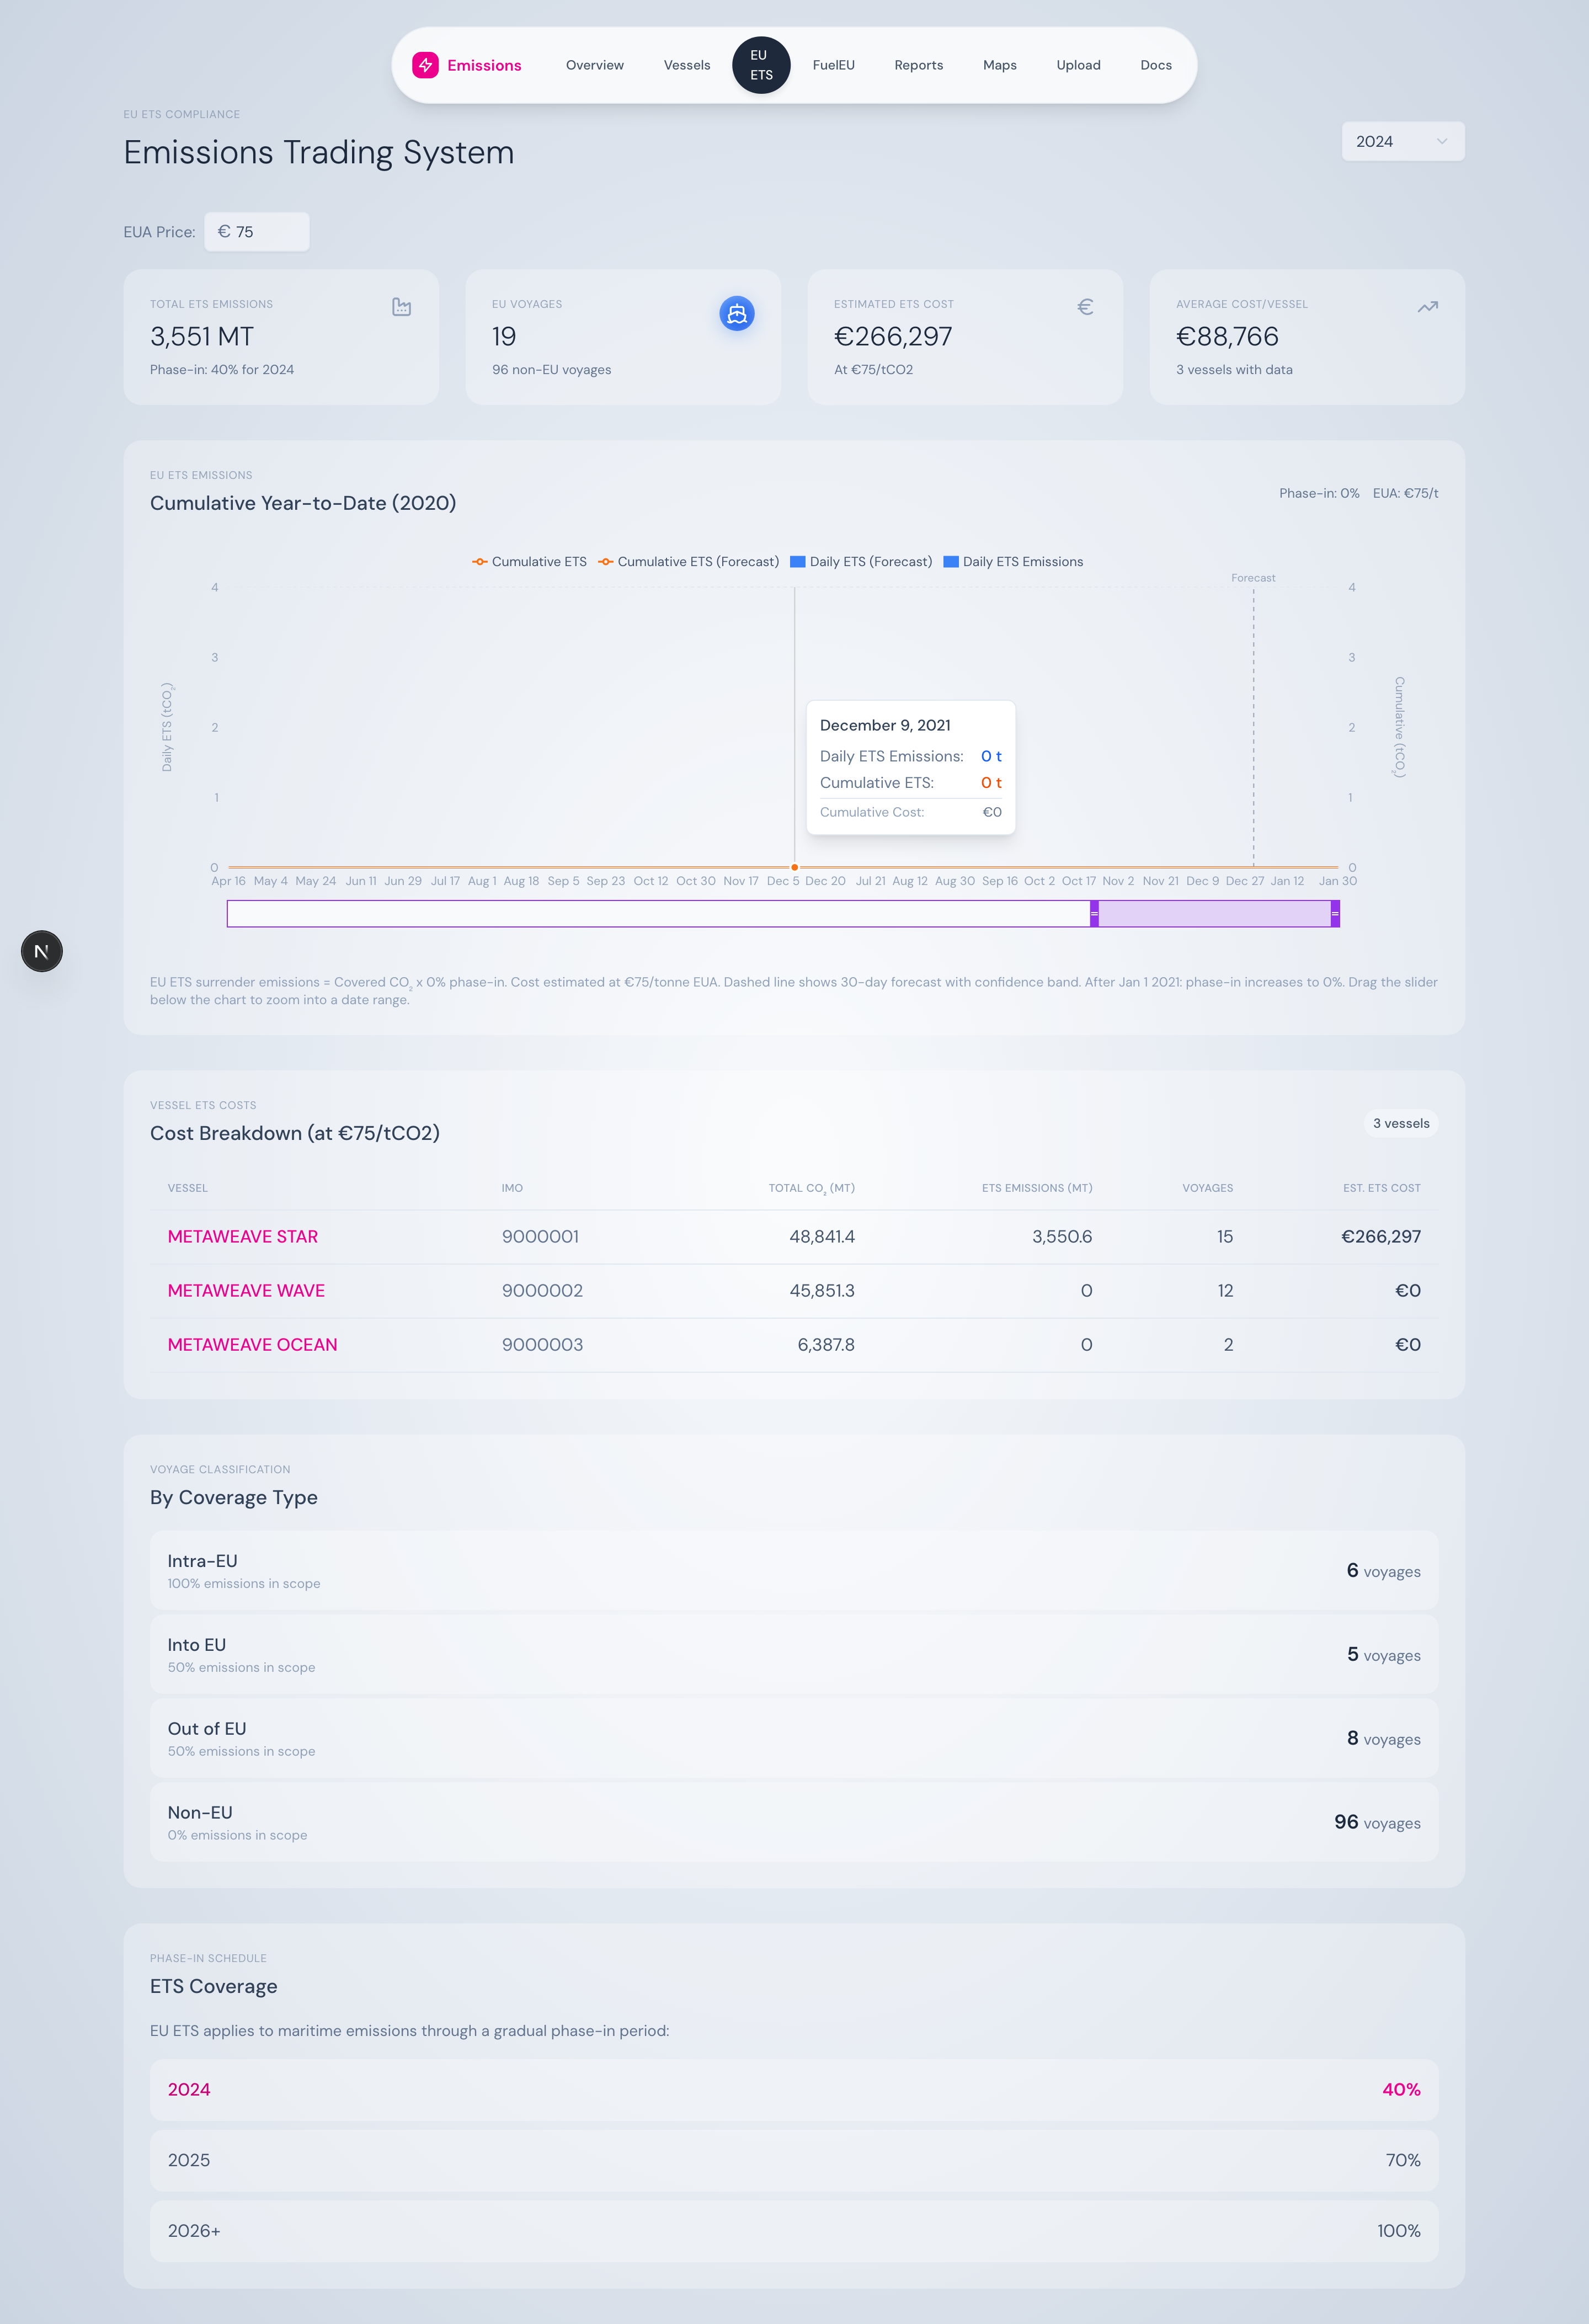
Voyage classification table with coverage rules.
A table of all four leg types — Intra-EU (100%), Into-EU (50%), Out-of-EU (50%), Non-EU (0%) — with counts and cost contribution.
Leg-level detail
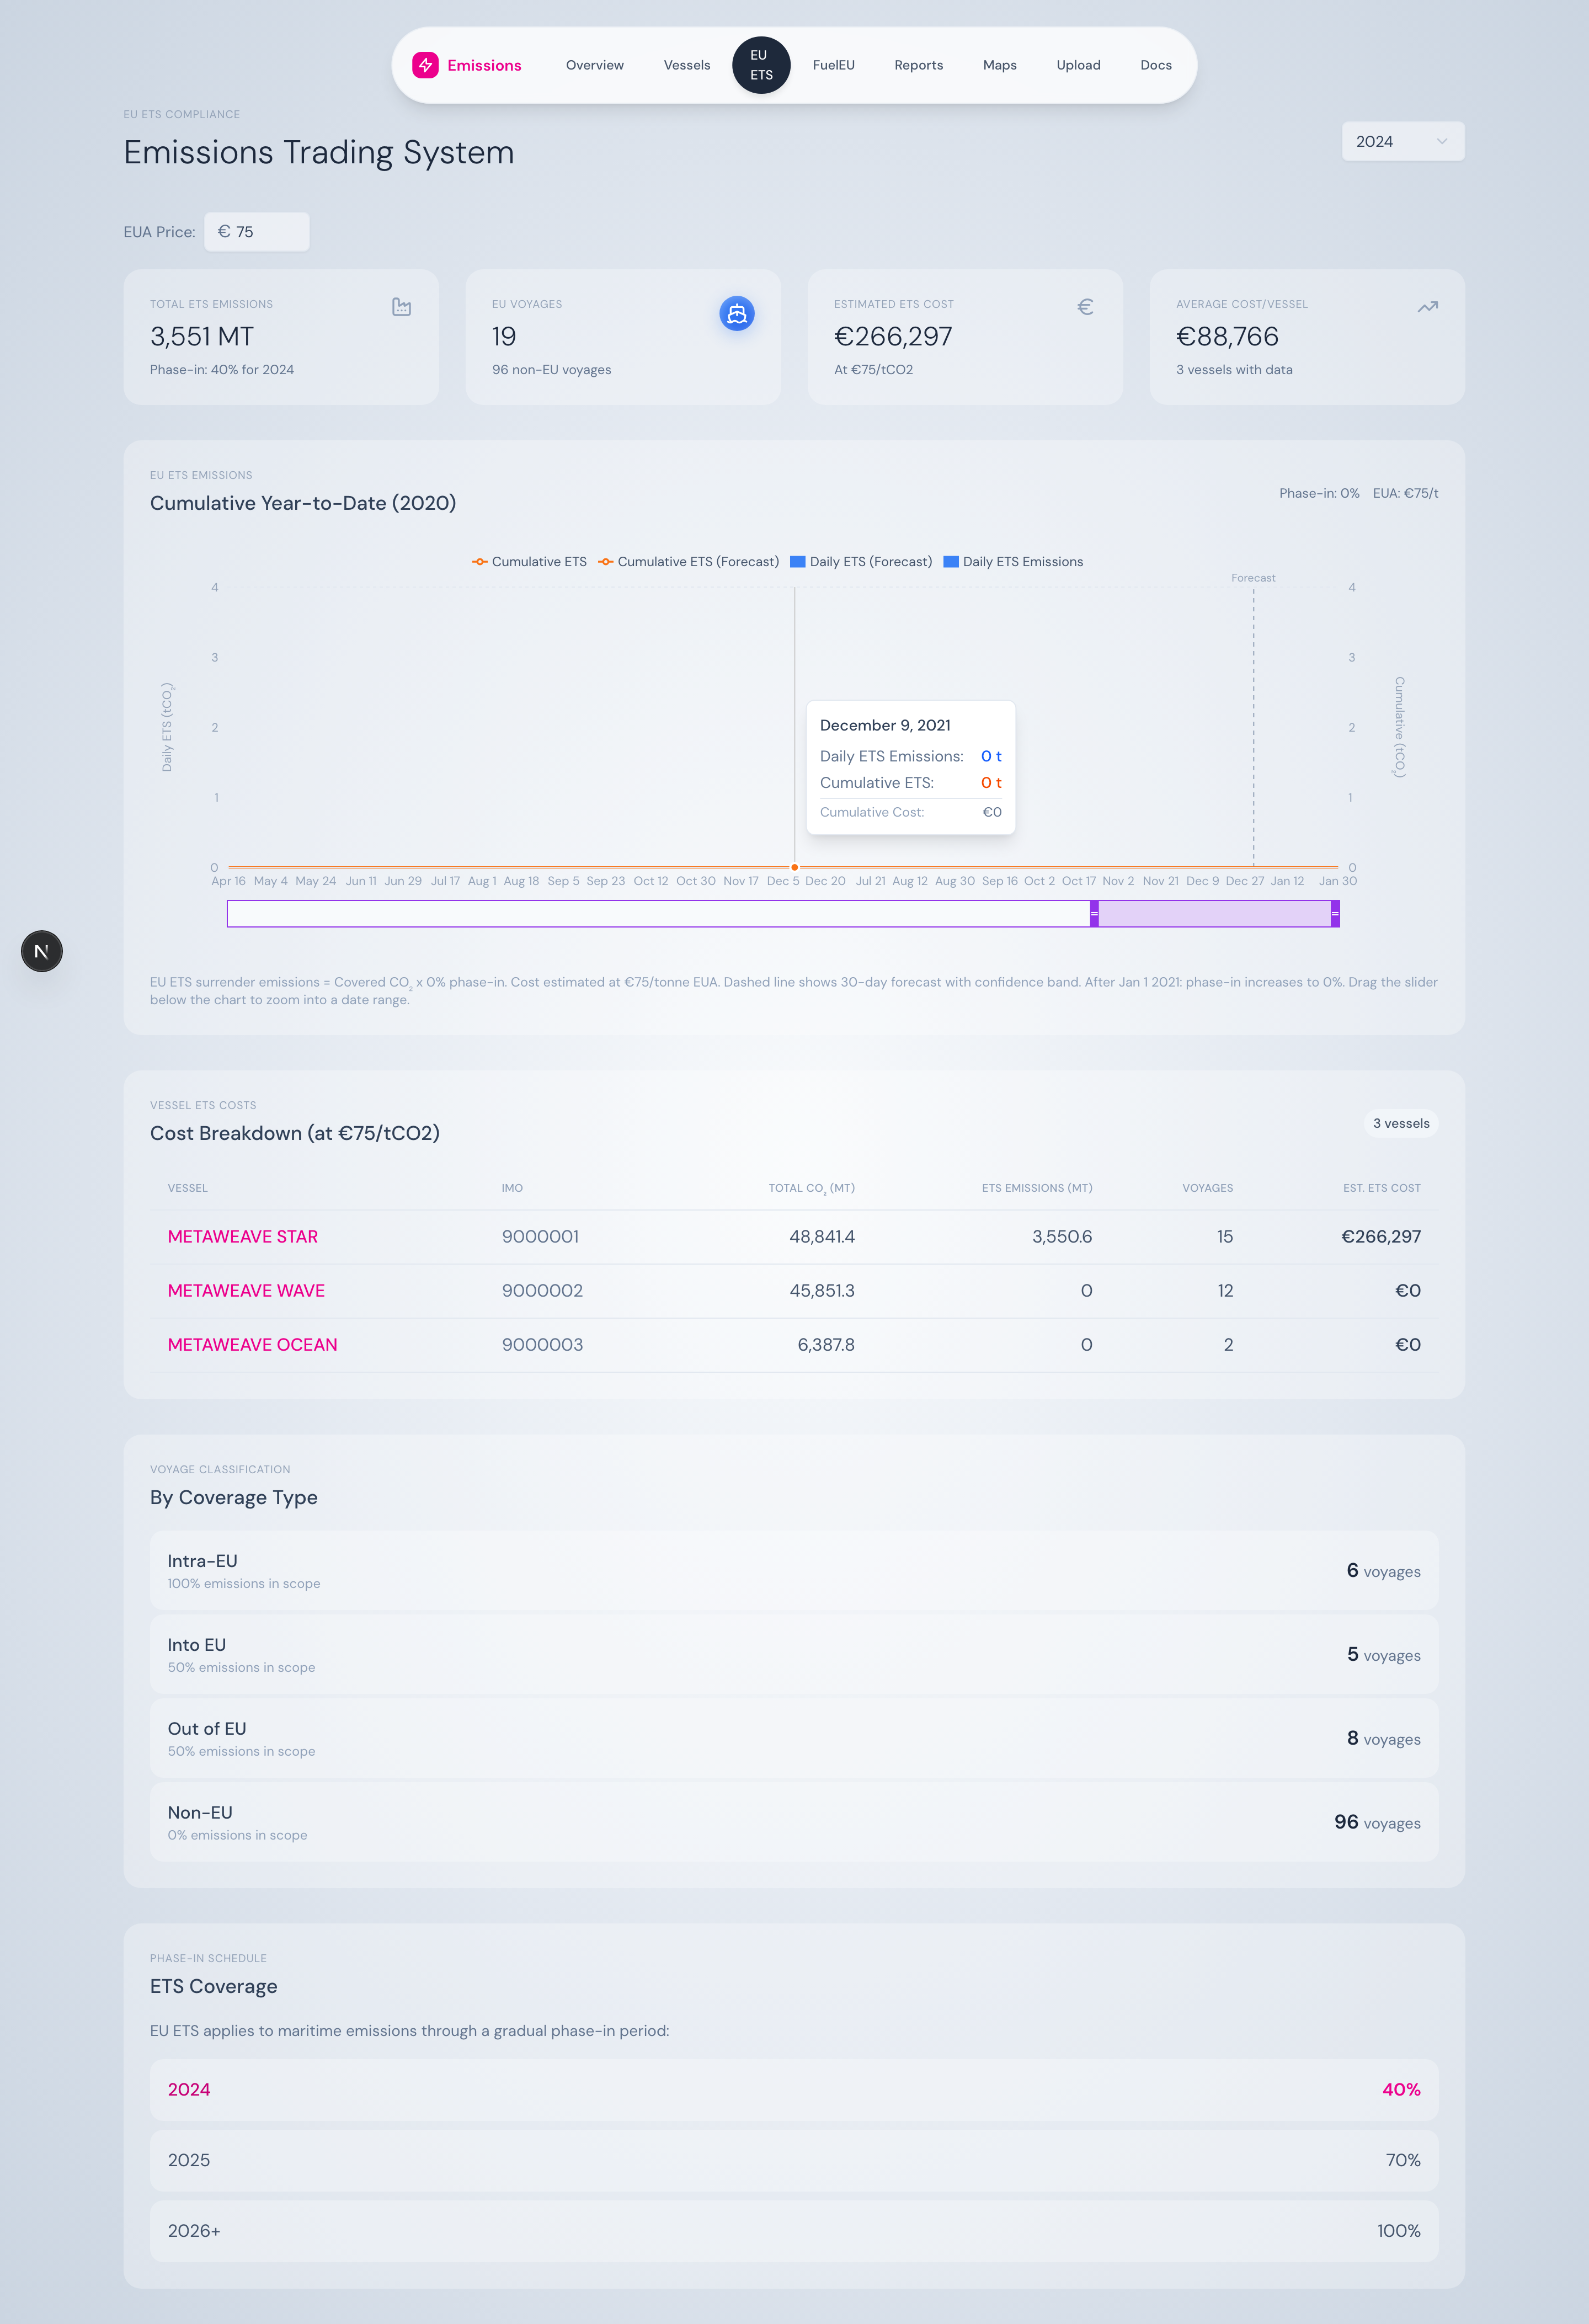
Leg-level voyage table with covered CO₂ per leg.
Expandable rows give you leg-by-leg figures: total CO₂, sea CO₂, sea-covered (factor applied), EU-port CO₂, total covered.
What you can do here
- Forecast the year’s ETS cost at the current EUA price
- Identify which trade lanes drive most of your exposure
- Verify per-leg coverage with full audit trail back to the consumption log
- Compare year-over-year as the phase-in ramps from 40% → 70% → 100%
Source
Powered by the same VoyageSegmentService that drives vessel detail pages. Coverage logic in src/lib/utils/portClassifier.ts.