FuelEU dashboard
The FuelEU dashboard is where you’ll find out, on any given day, whether your fleet is on track to comply — and what a non-compliance penalty would cost.
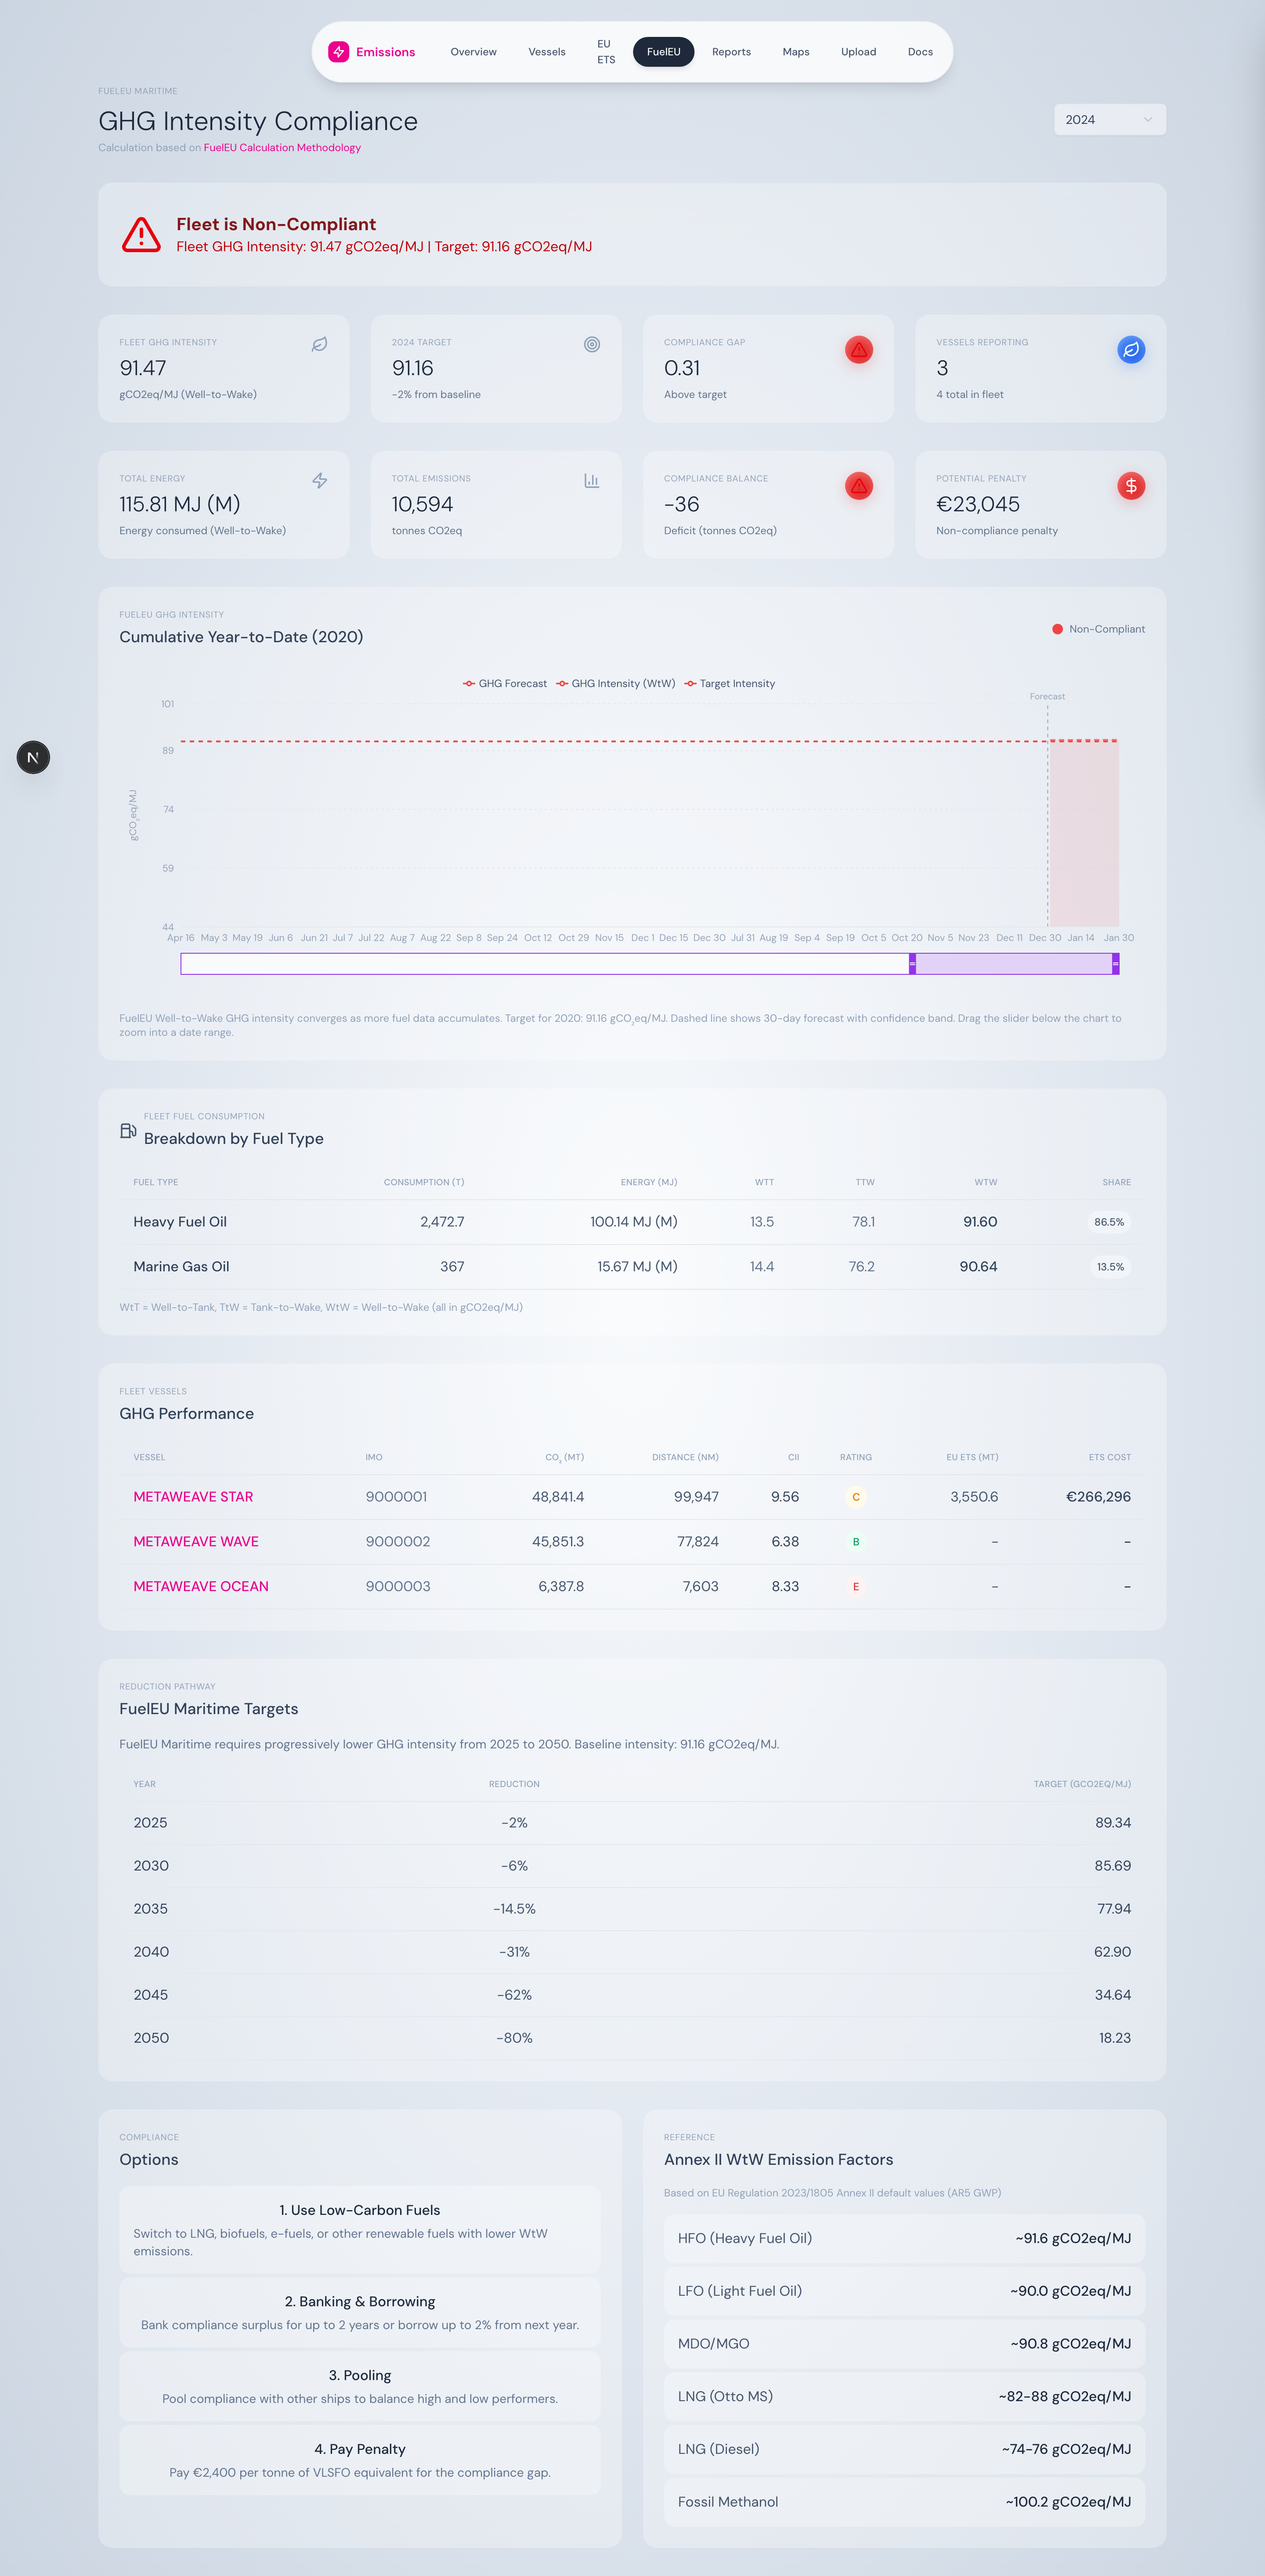
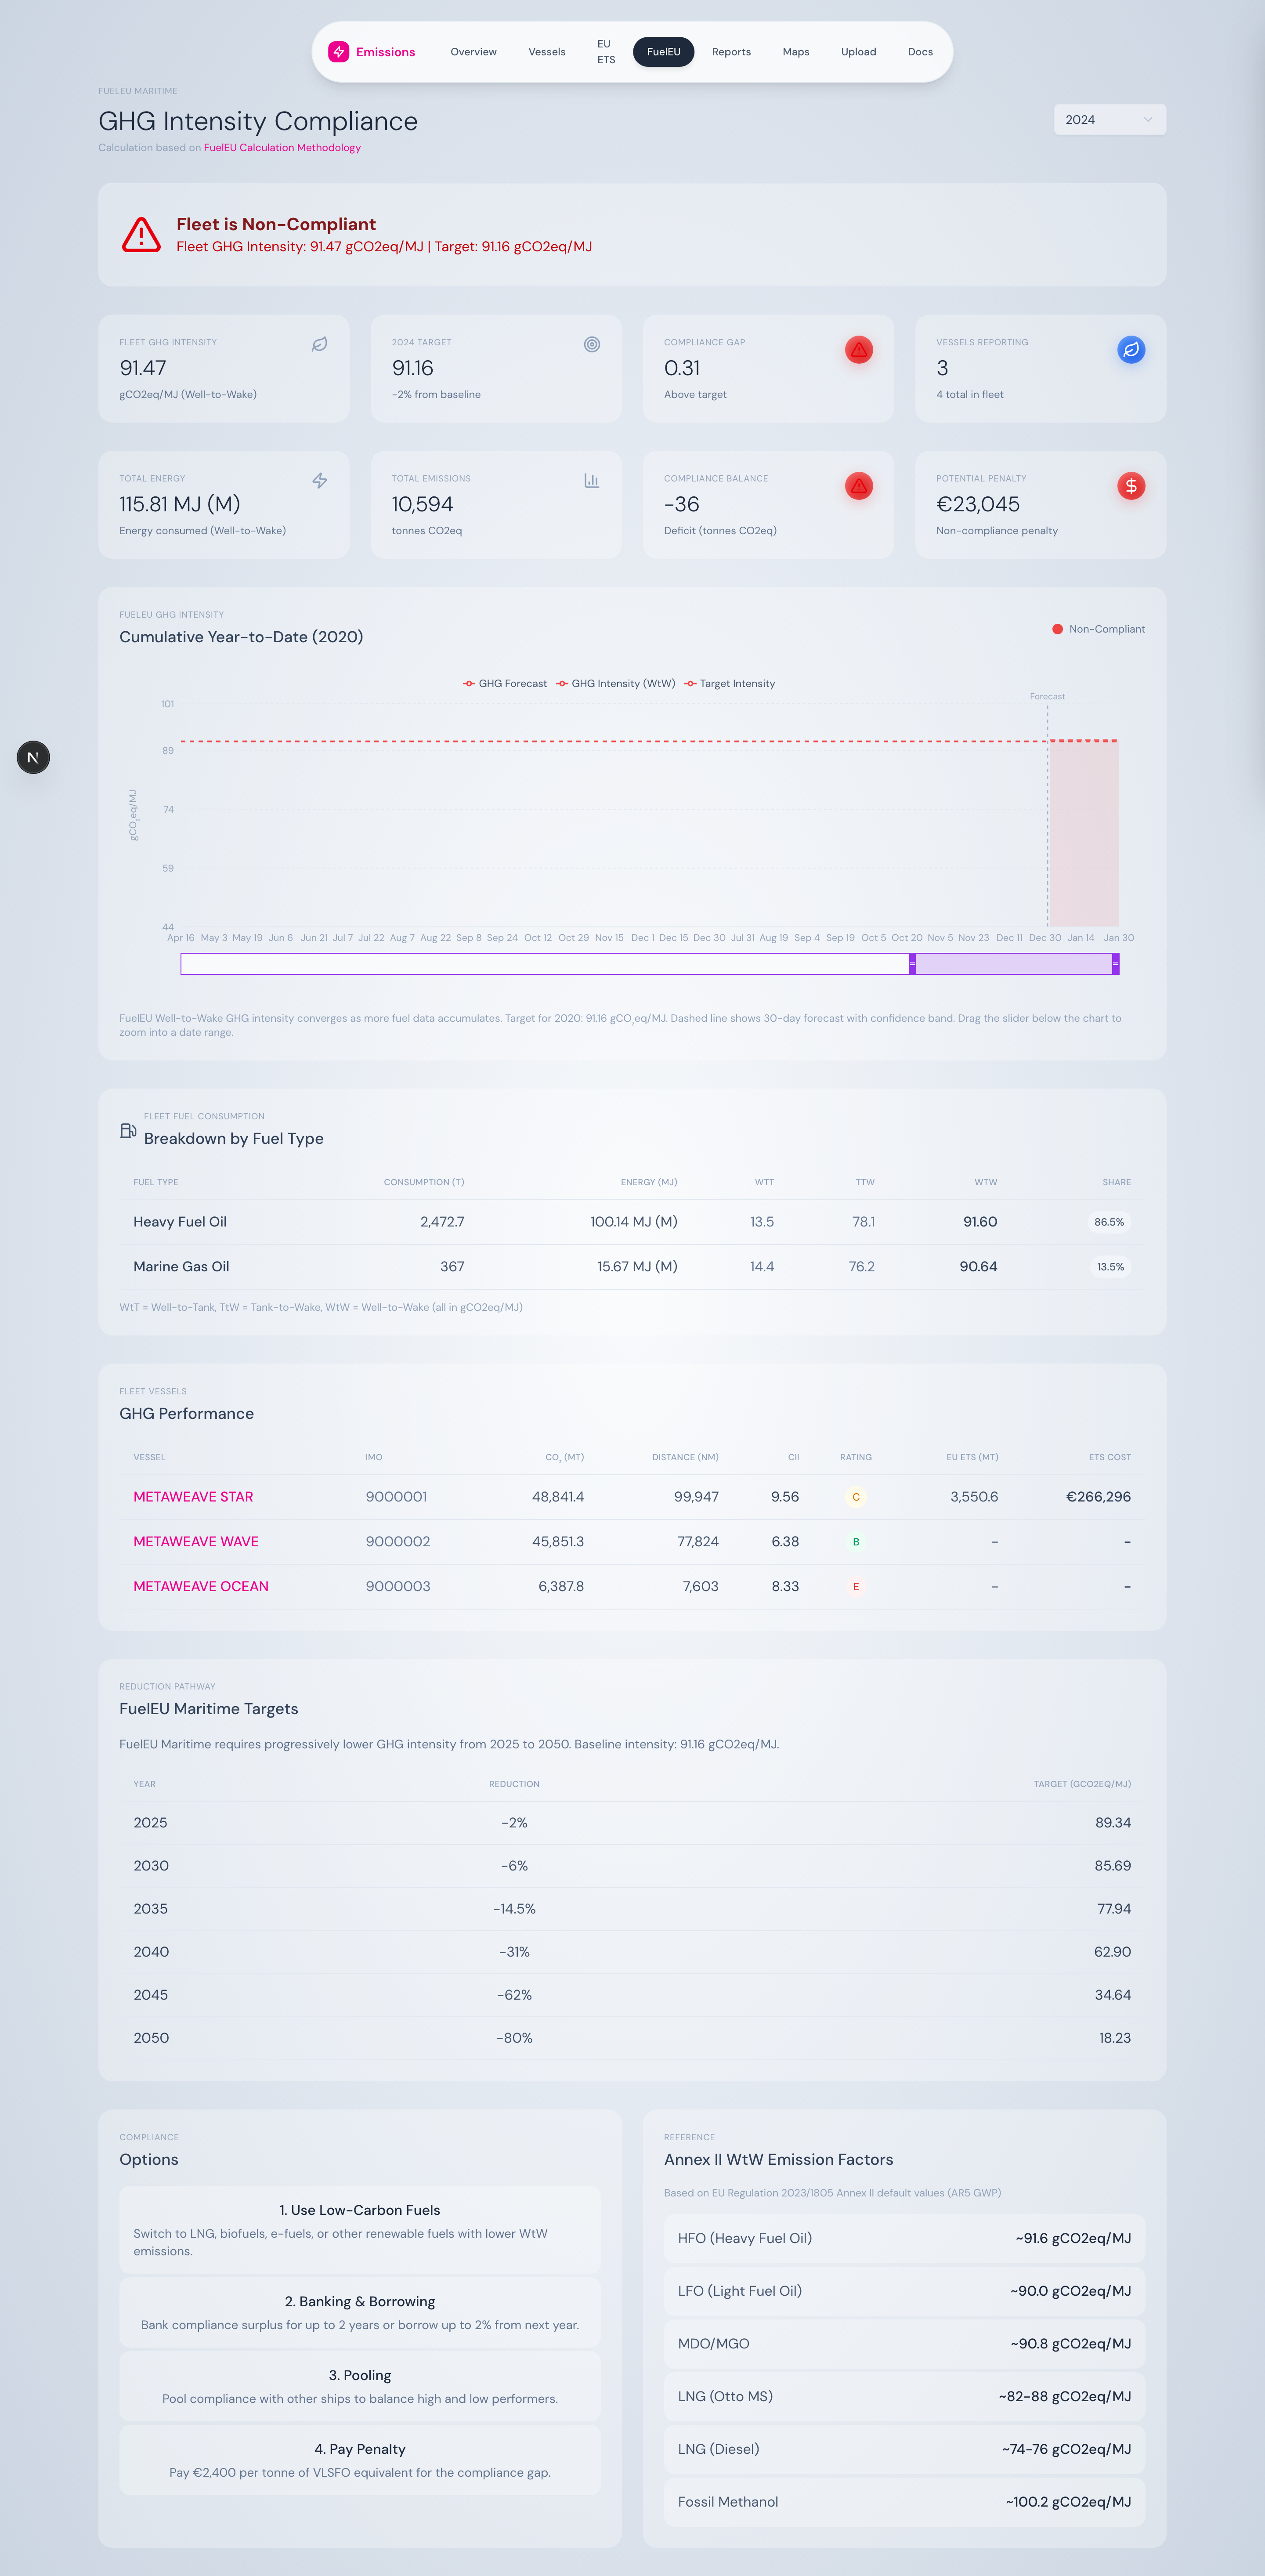
FuelEU dashboard — compliance banner, summary cards, and daily intensity chart.
What’s on the page
Compliance banner
A green or red banner answers the headline question: are you compliant for the selected year? It shows fleet GHG intensity, the year’s target, and the gap.
Summary cards
- Fleet GHG Intensity (gCO₂eq/MJ)
- Year target + reduction percentage
- Compliance Gap — actual minus target
- Vessels Reporting — count
Plus a second row of energy/compliance metrics:
- Total Energy (MJ, formatted in TJ/GJ)
- Total Emissions (tonnes CO₂eq)
- Compliance Balance — surplus or deficit, in tonnes CO₂eq
- Potential Penalty (€) — calculated only if non-compliant
Daily intensity chart
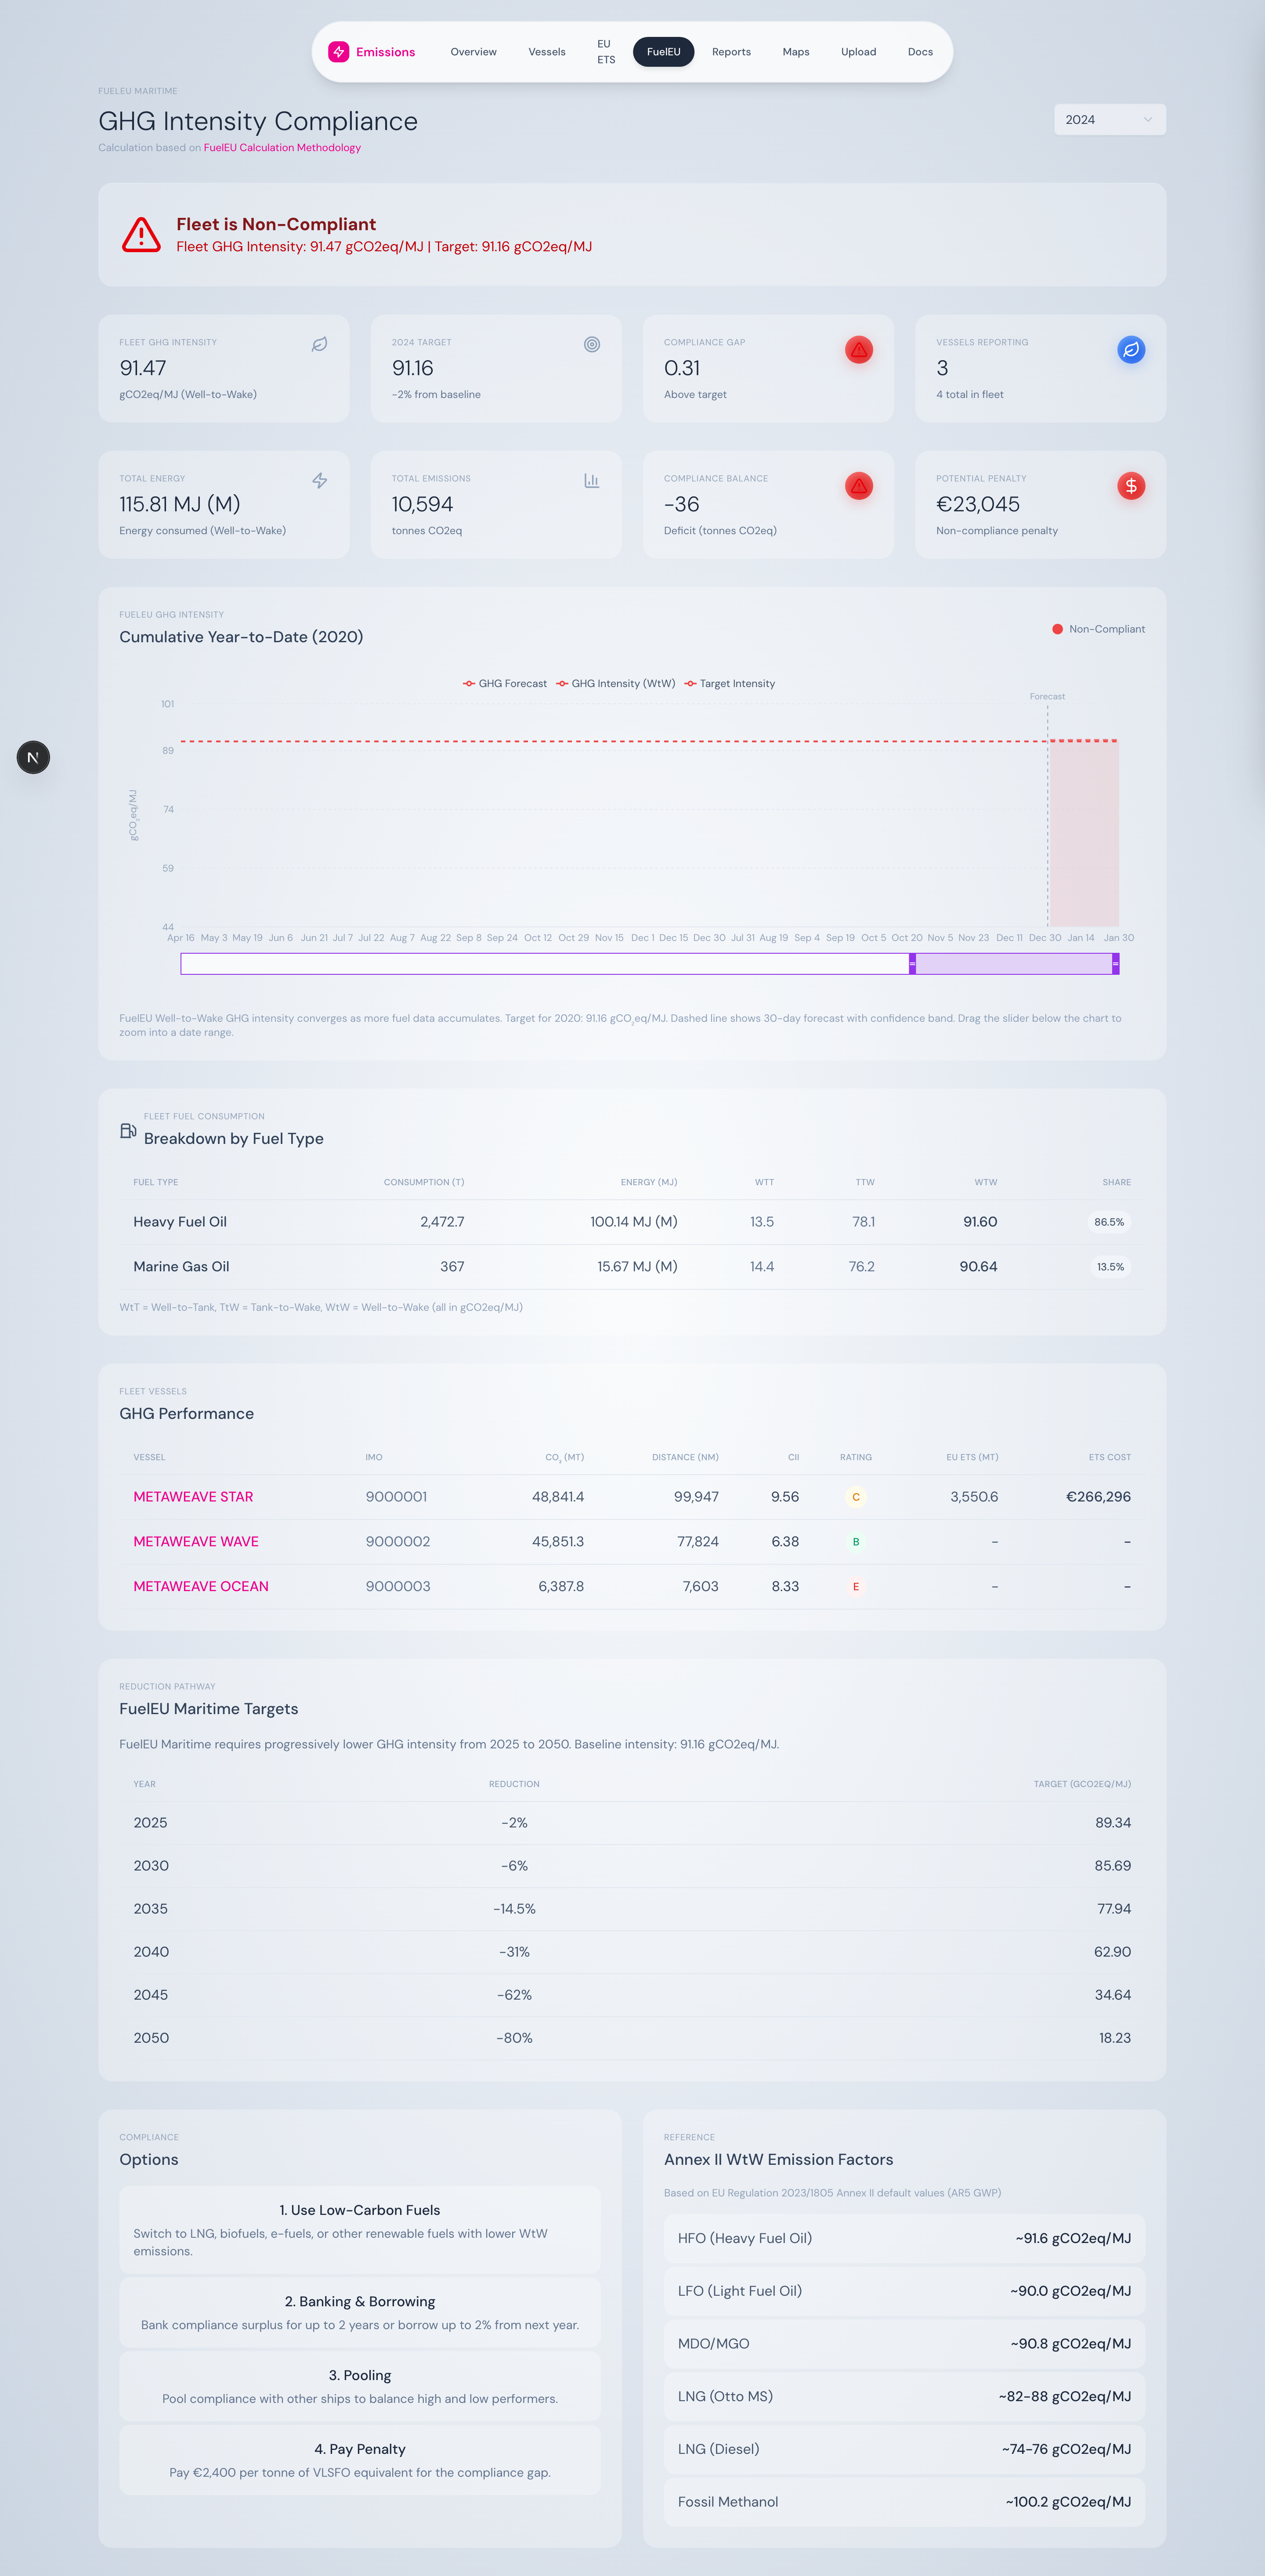
Daily fleet GHG intensity vs. the year’s target line.
A timeline of fleet GHG intensity through the year, with the target as a horizontal threshold line. Background colour shifts indicate which periods were compliant vs. non-compliant. Hover for the exact intensity on any day.
Fuel breakdown
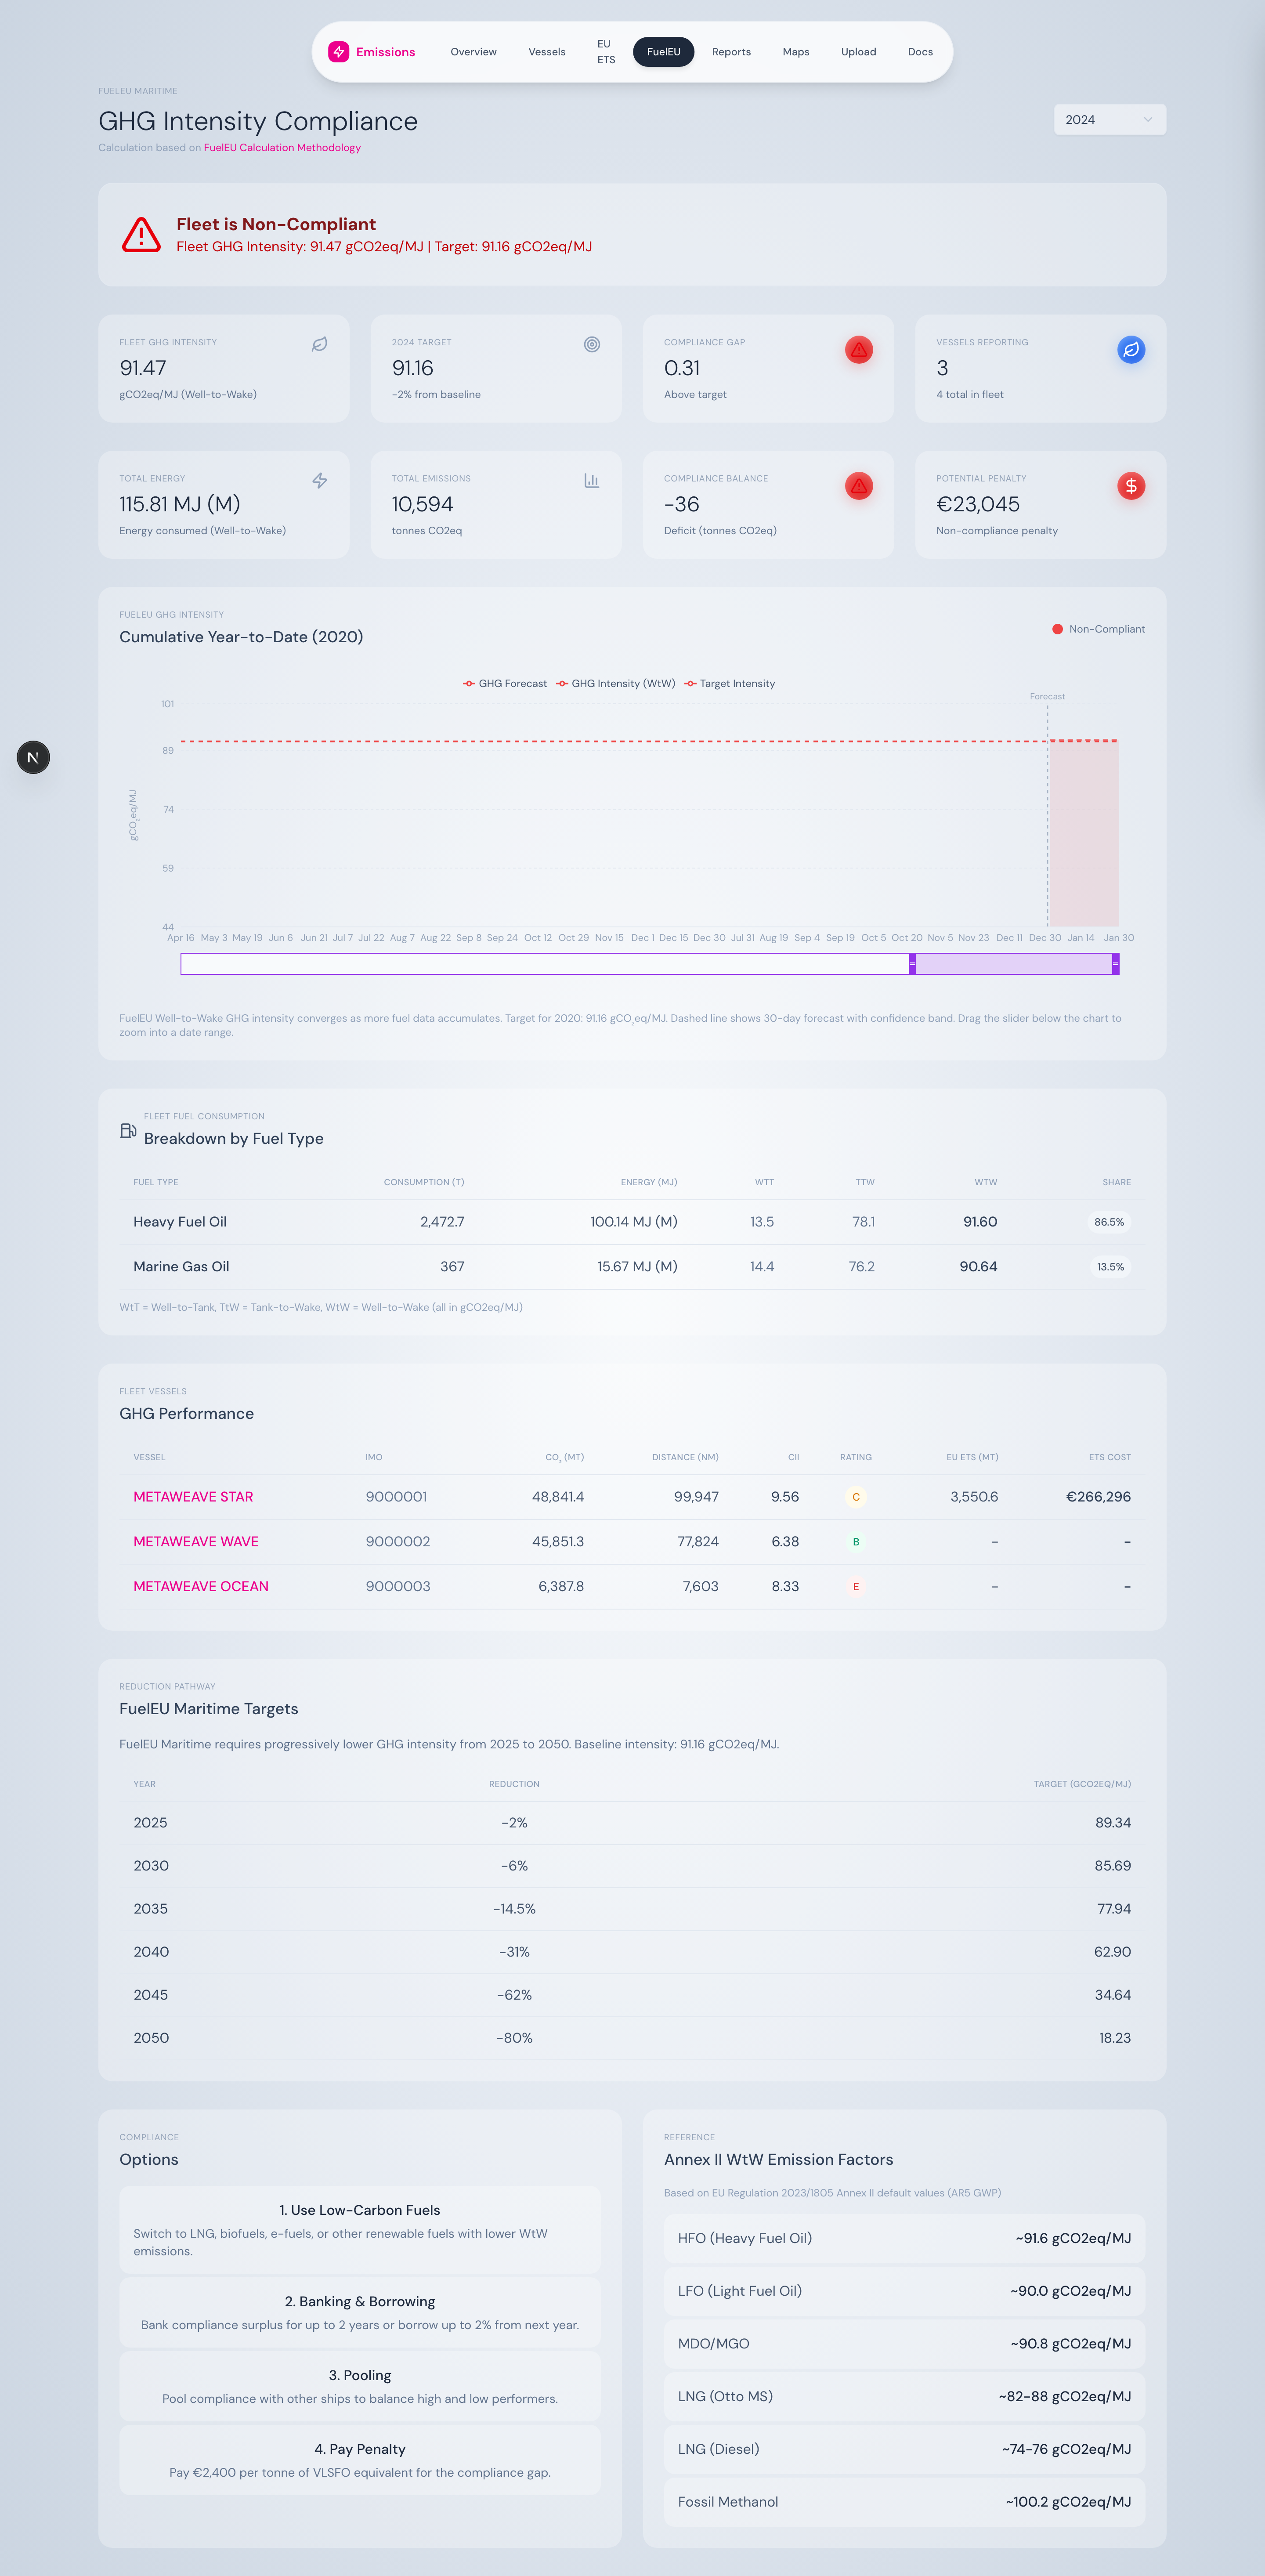
Fuel mix table — consumption, energy, WtT, TtW, WtW, share %.
One row per fuel type in use:
| Column | Meaning |
|---|---|
| Fuel Type | HFO, MGO, LNG, Bio-Blend, etc. |
| Consumption (T) | Tonnes burned |
| Energy (MJ) | Tonnes × LCV |
| WtT | Well-to-Tank intensity (gCO₂eq/MJ) |
| TtW | Tank-to-Wake intensity (gCO₂eq/MJ) |
| WtW | Total = WtT + TtW |
| Share % | % of total fleet energy |
Per-vessel ranking
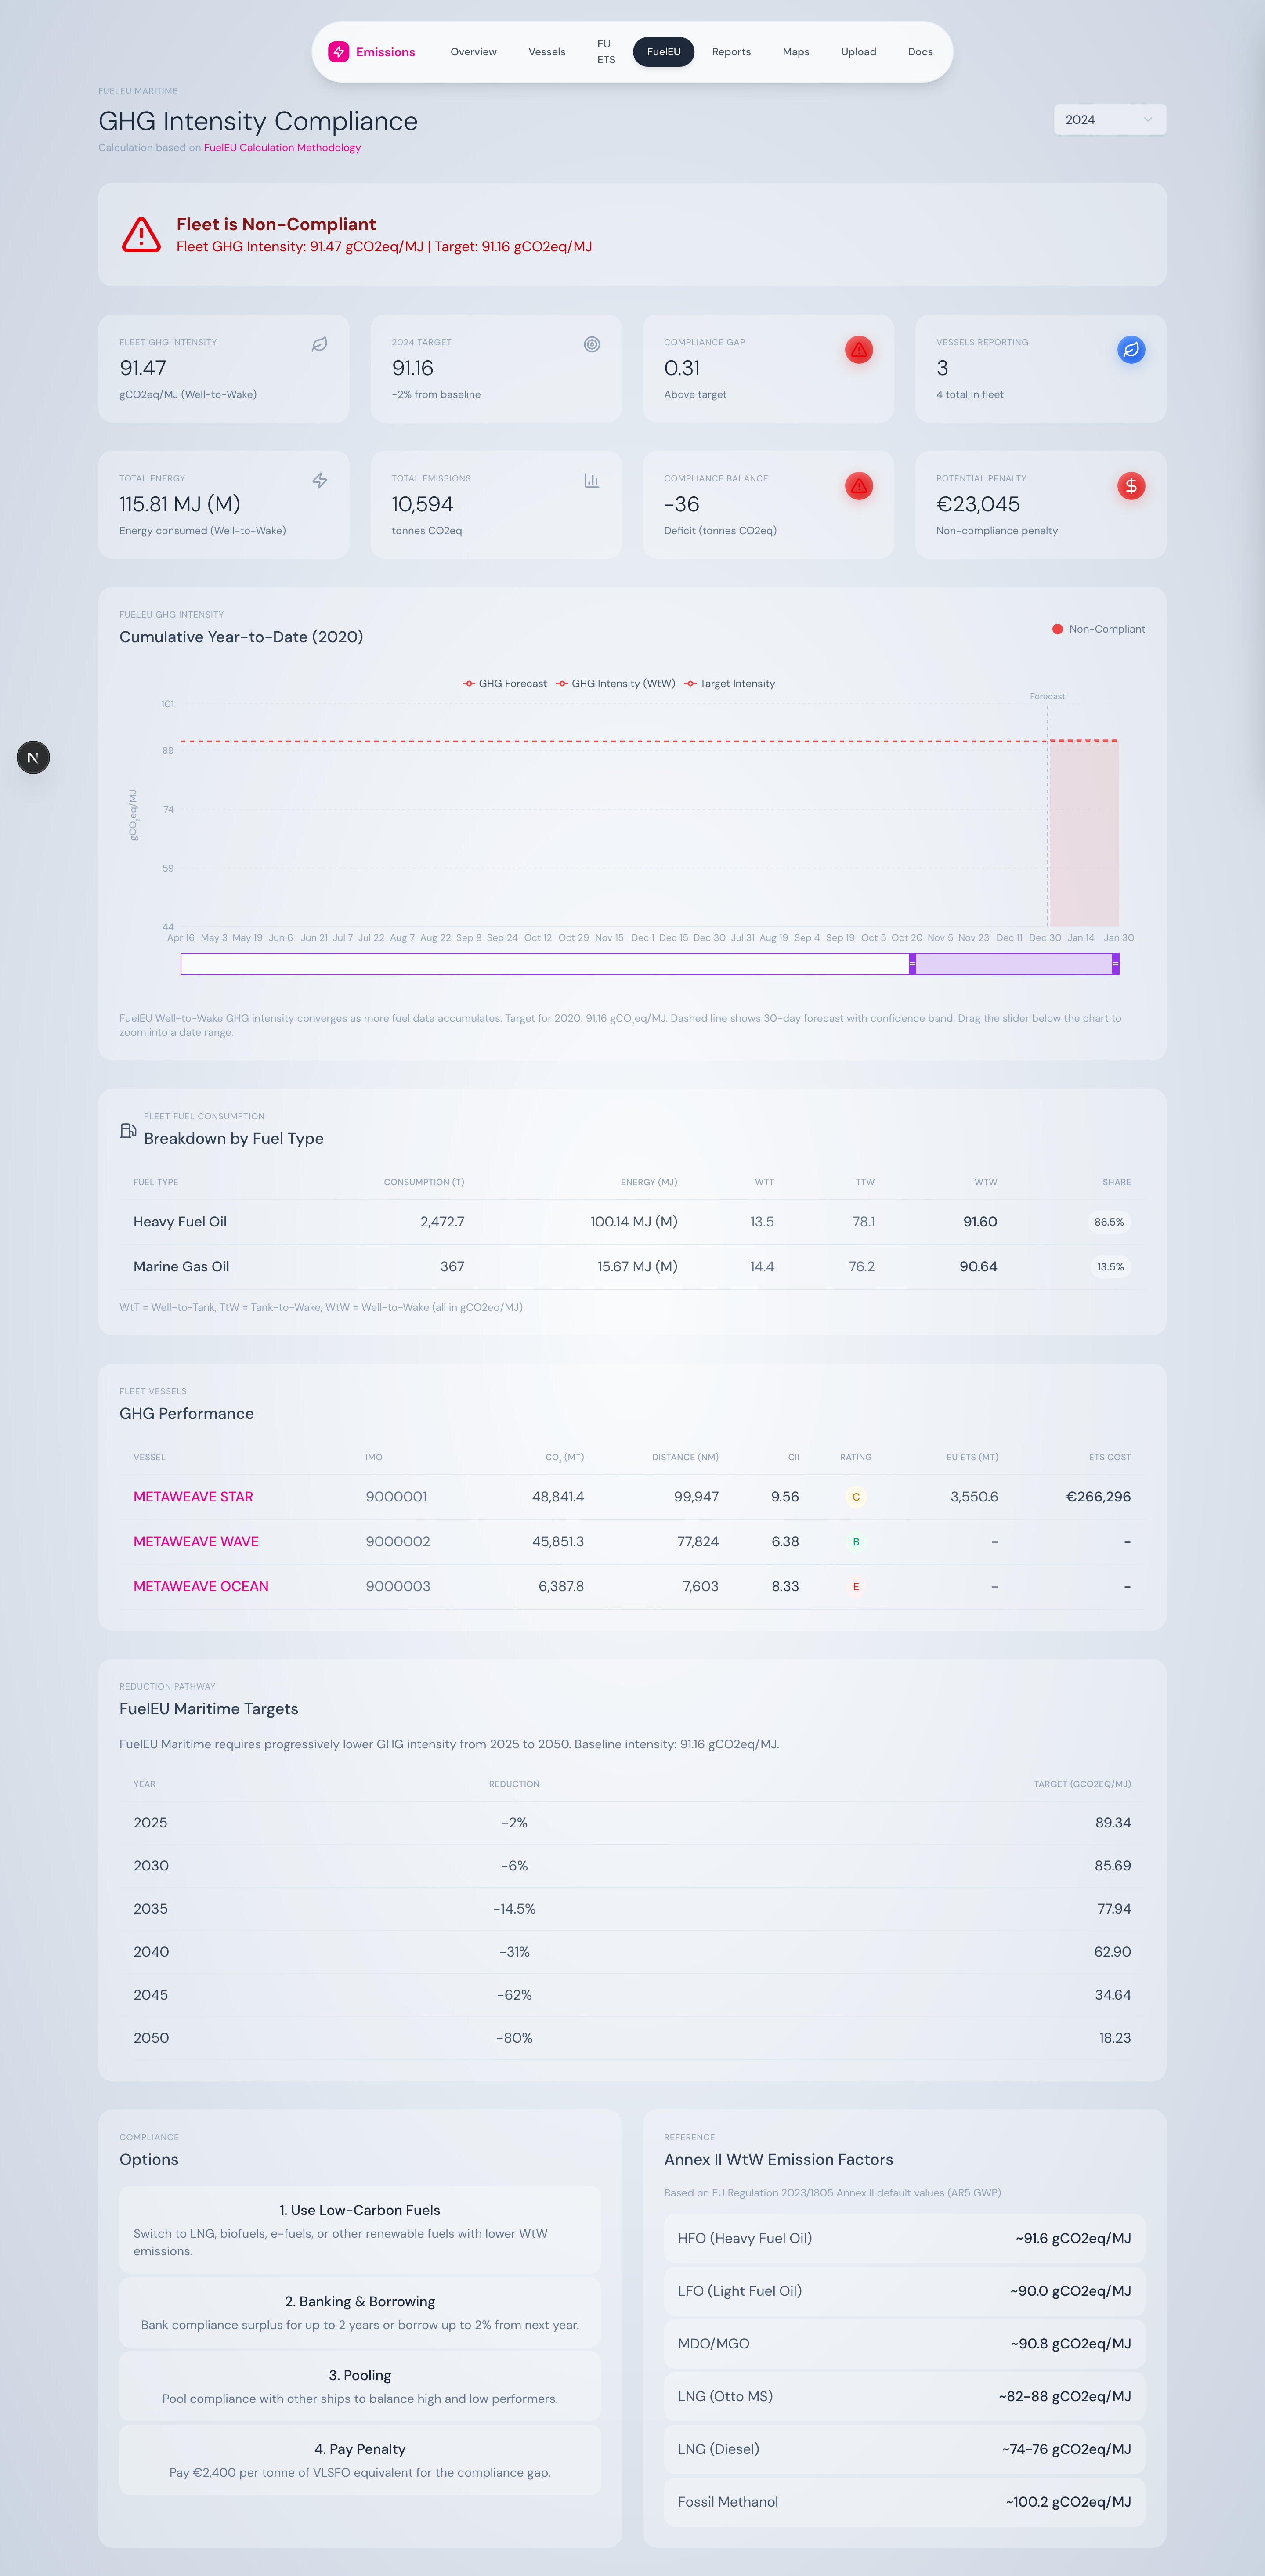
Vessels ranked by GHG intensity, best to worst.
Which ships are pulling the fleet above target? This table ranks every vessel from lowest intensity to highest, with compliance badges for instant identification.
Reduction pathway reference
Built-in reference for FuelEU targets 2025–2050.
A static reference table showing the entire FuelEU trajectory through 2050 — useful for fleet-transition planning.
Annex II factors reference
A second static reference table lists default WtT, TtW, and WtW values for every supported fuel — what the platform uses when no measured value is provided.
What you can do here
- Track GHG intensity day-by-day across the year
- Identify which vessels and which fuels are dragging compliance down
- Model penalty exposure at current consumption levels
- Plan fleet transitions against the 2030 / 2035 / 2040 targets
- Generate the FuelEU Maritime Report for verifier submission
Source
Logic in src/lib/utils/fuelEUCalculator.ts. Hydrated from FleetService.getFleetSummary().