Maritime Emissions Dashboard
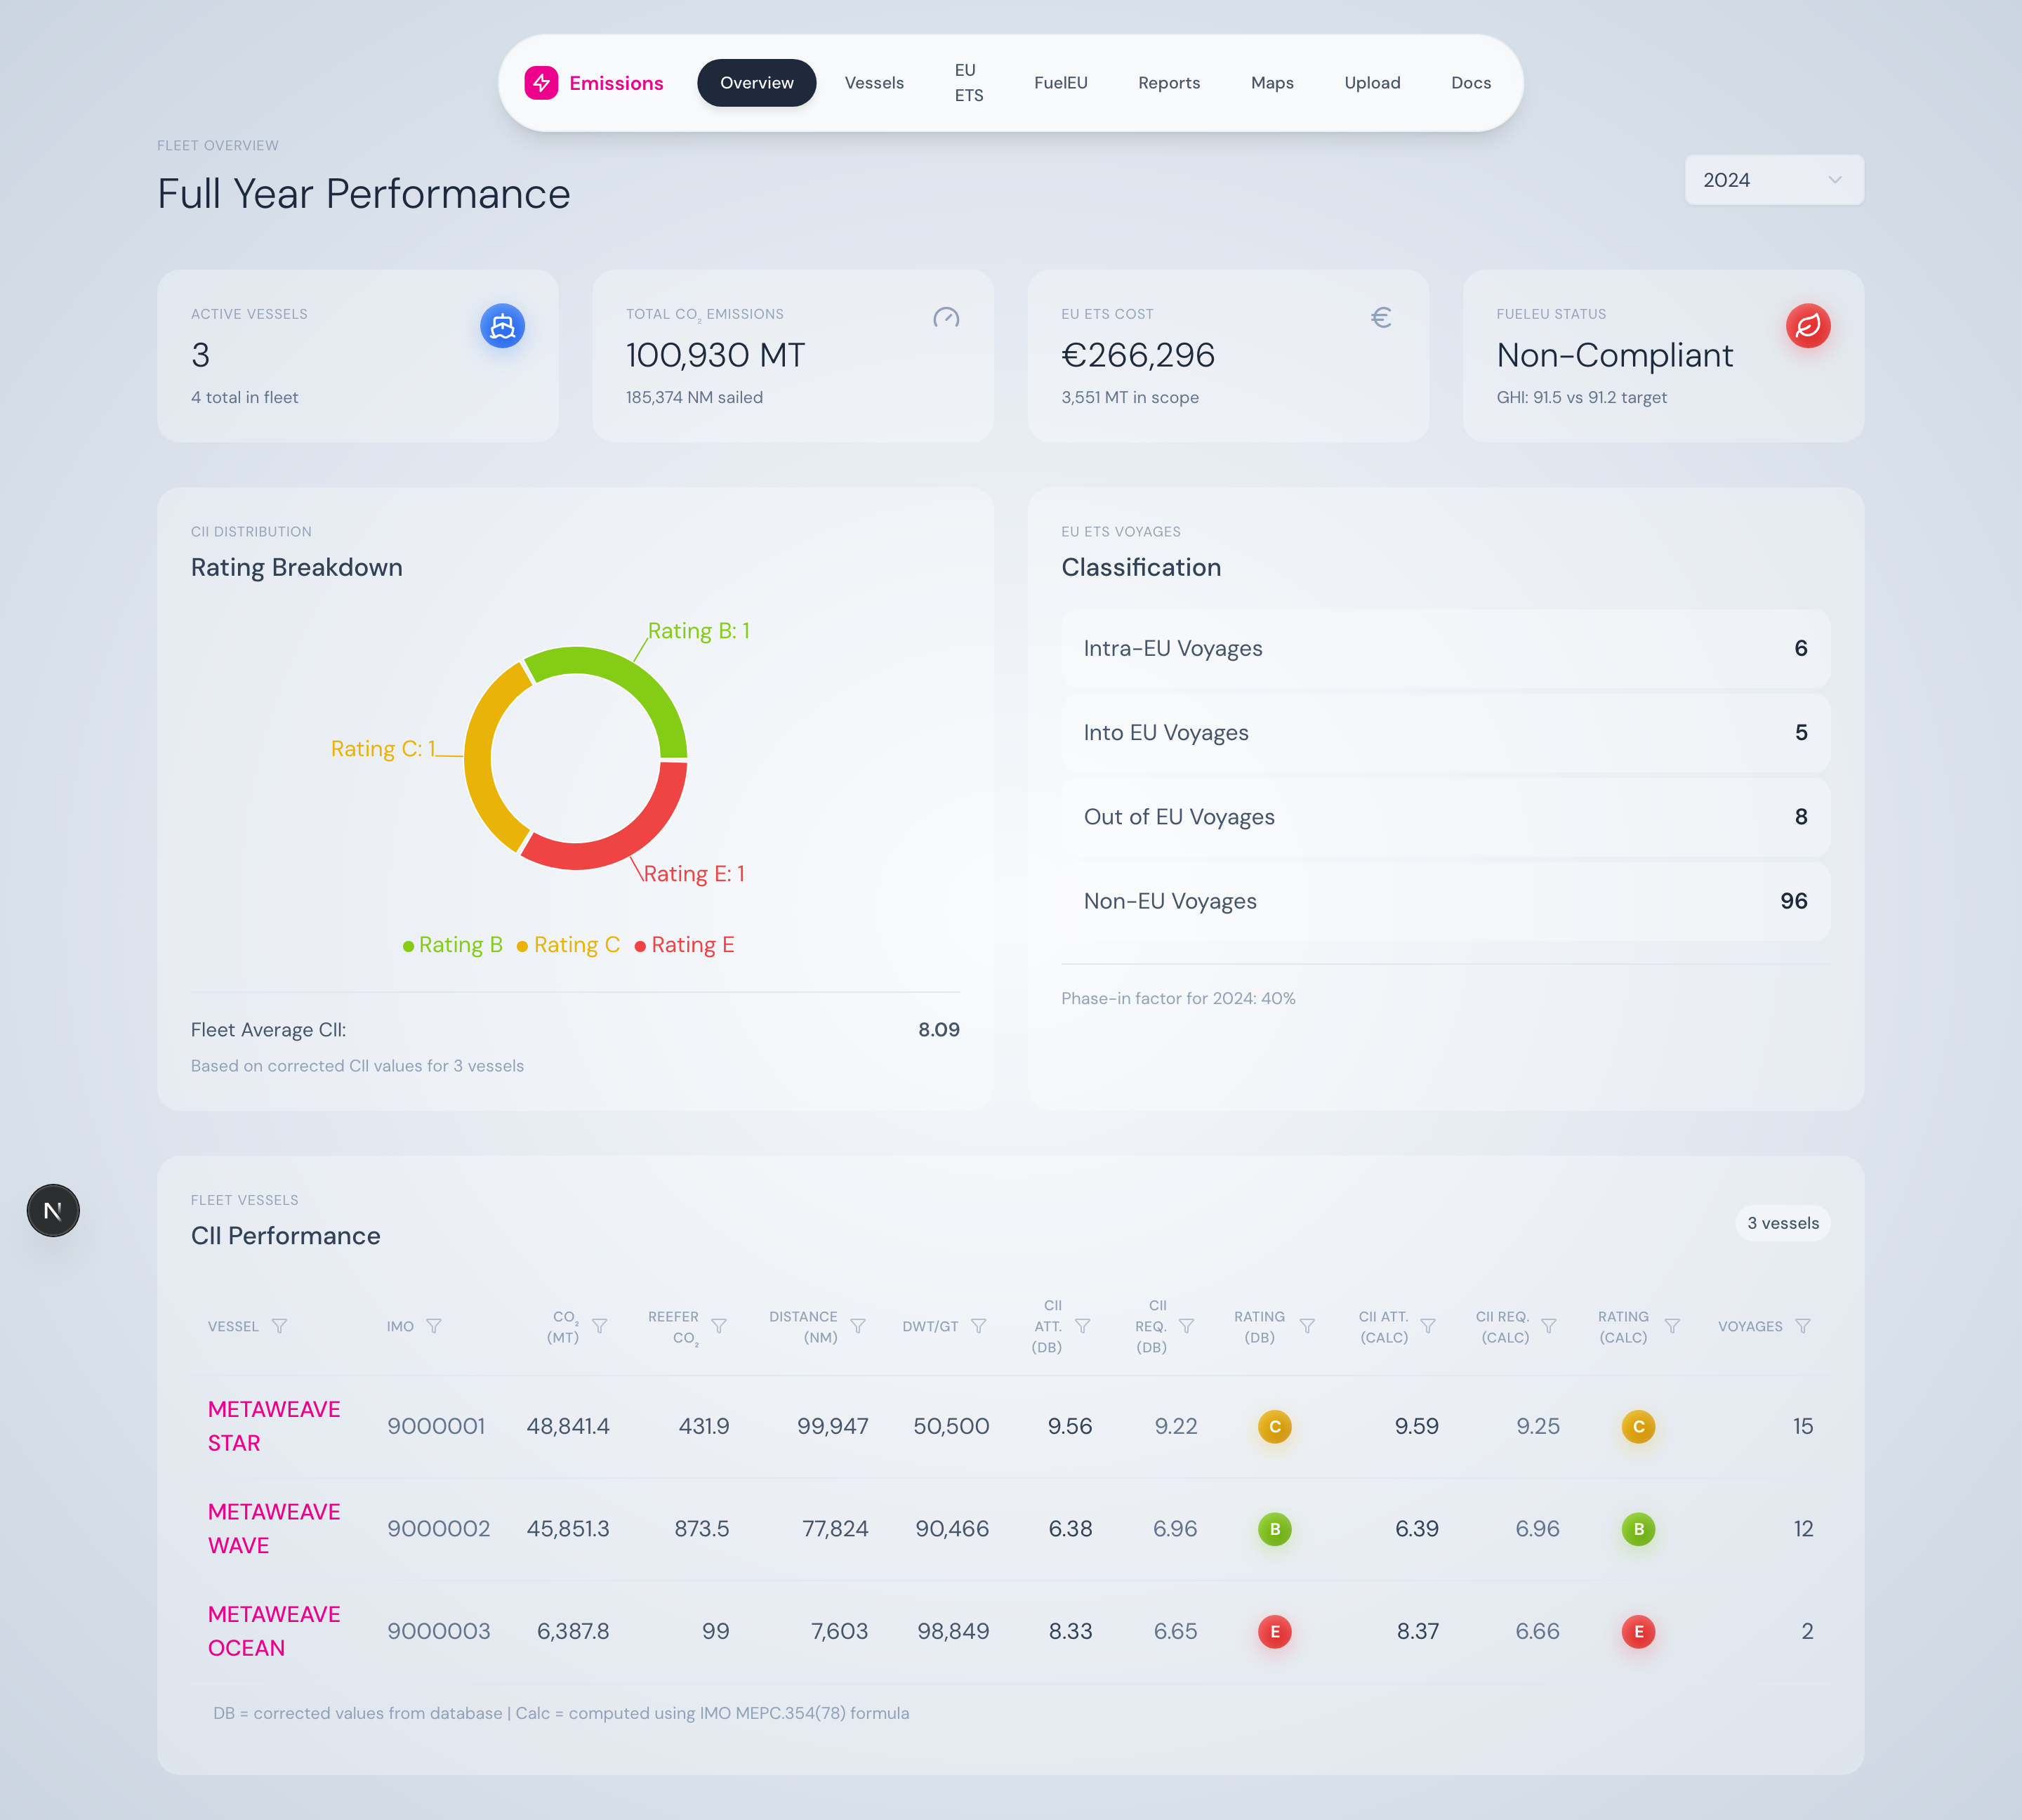
Fleet overview — annual emissions, compliance status, and CII distribution at a glance.
What is this?
The Maritime Emissions Dashboard turns vessel consumption logs into the regulatory artefacts every shipowner now has to file: a CII rating, an EU ETS allowance bill, a FuelEU GHG-intensity statement, an EU MRV voyage report, and an IMO DCS submission.
You upload your fleet’s consumption data once. The platform computes everything, every regulation, every vessel, every voyage — and gives you the dashboards, drill-downs, and downloadable reports you need to operate and to file.
What it covers
What you can do with it
-
See the whole fleet at once
A single year-selector drives the entire app. Every page — fleet overview, ETS, FuelEU, vessel detail — refreshes to the year you pick.
-
Drill from fleet to vessel to voyage to leg
Click a row in the fleet table → land on the vessel page → expand a voyage → see leg-by-leg ETS coverage.
-
Watch trends, not just totals
Daily timeline charts for CII, GHG intensity, and EU ETS exposure. Brush-to-zoom and target lines built in.
-
Generate the reports your auditors need
One-click downloads for IMO DCS, CII Statement, EU MRV, EU ETS, and FuelEU — formatted for the right authority.
Who it’s for
The platform is built for shipping companies operating between 2 and 100+ vessels who need to comply with overlapping IMO and EU regulations without standing up a data-engineering team to do it.
Typical users:
- Fleet managers monitoring CII ratings and EU ETS exposure
- Environmental & compliance officers preparing annual filings
- Commercial teams modelling EUA costs into voyage P&L
- IT / digital teams integrating the platform into broader fleet systems