Vessel detail
このコンテンツはまだ日本語訳がありません。
The vessel page is where compliance teams spend most of their time. It shows everything one vessel did in one year, across all five regulations.
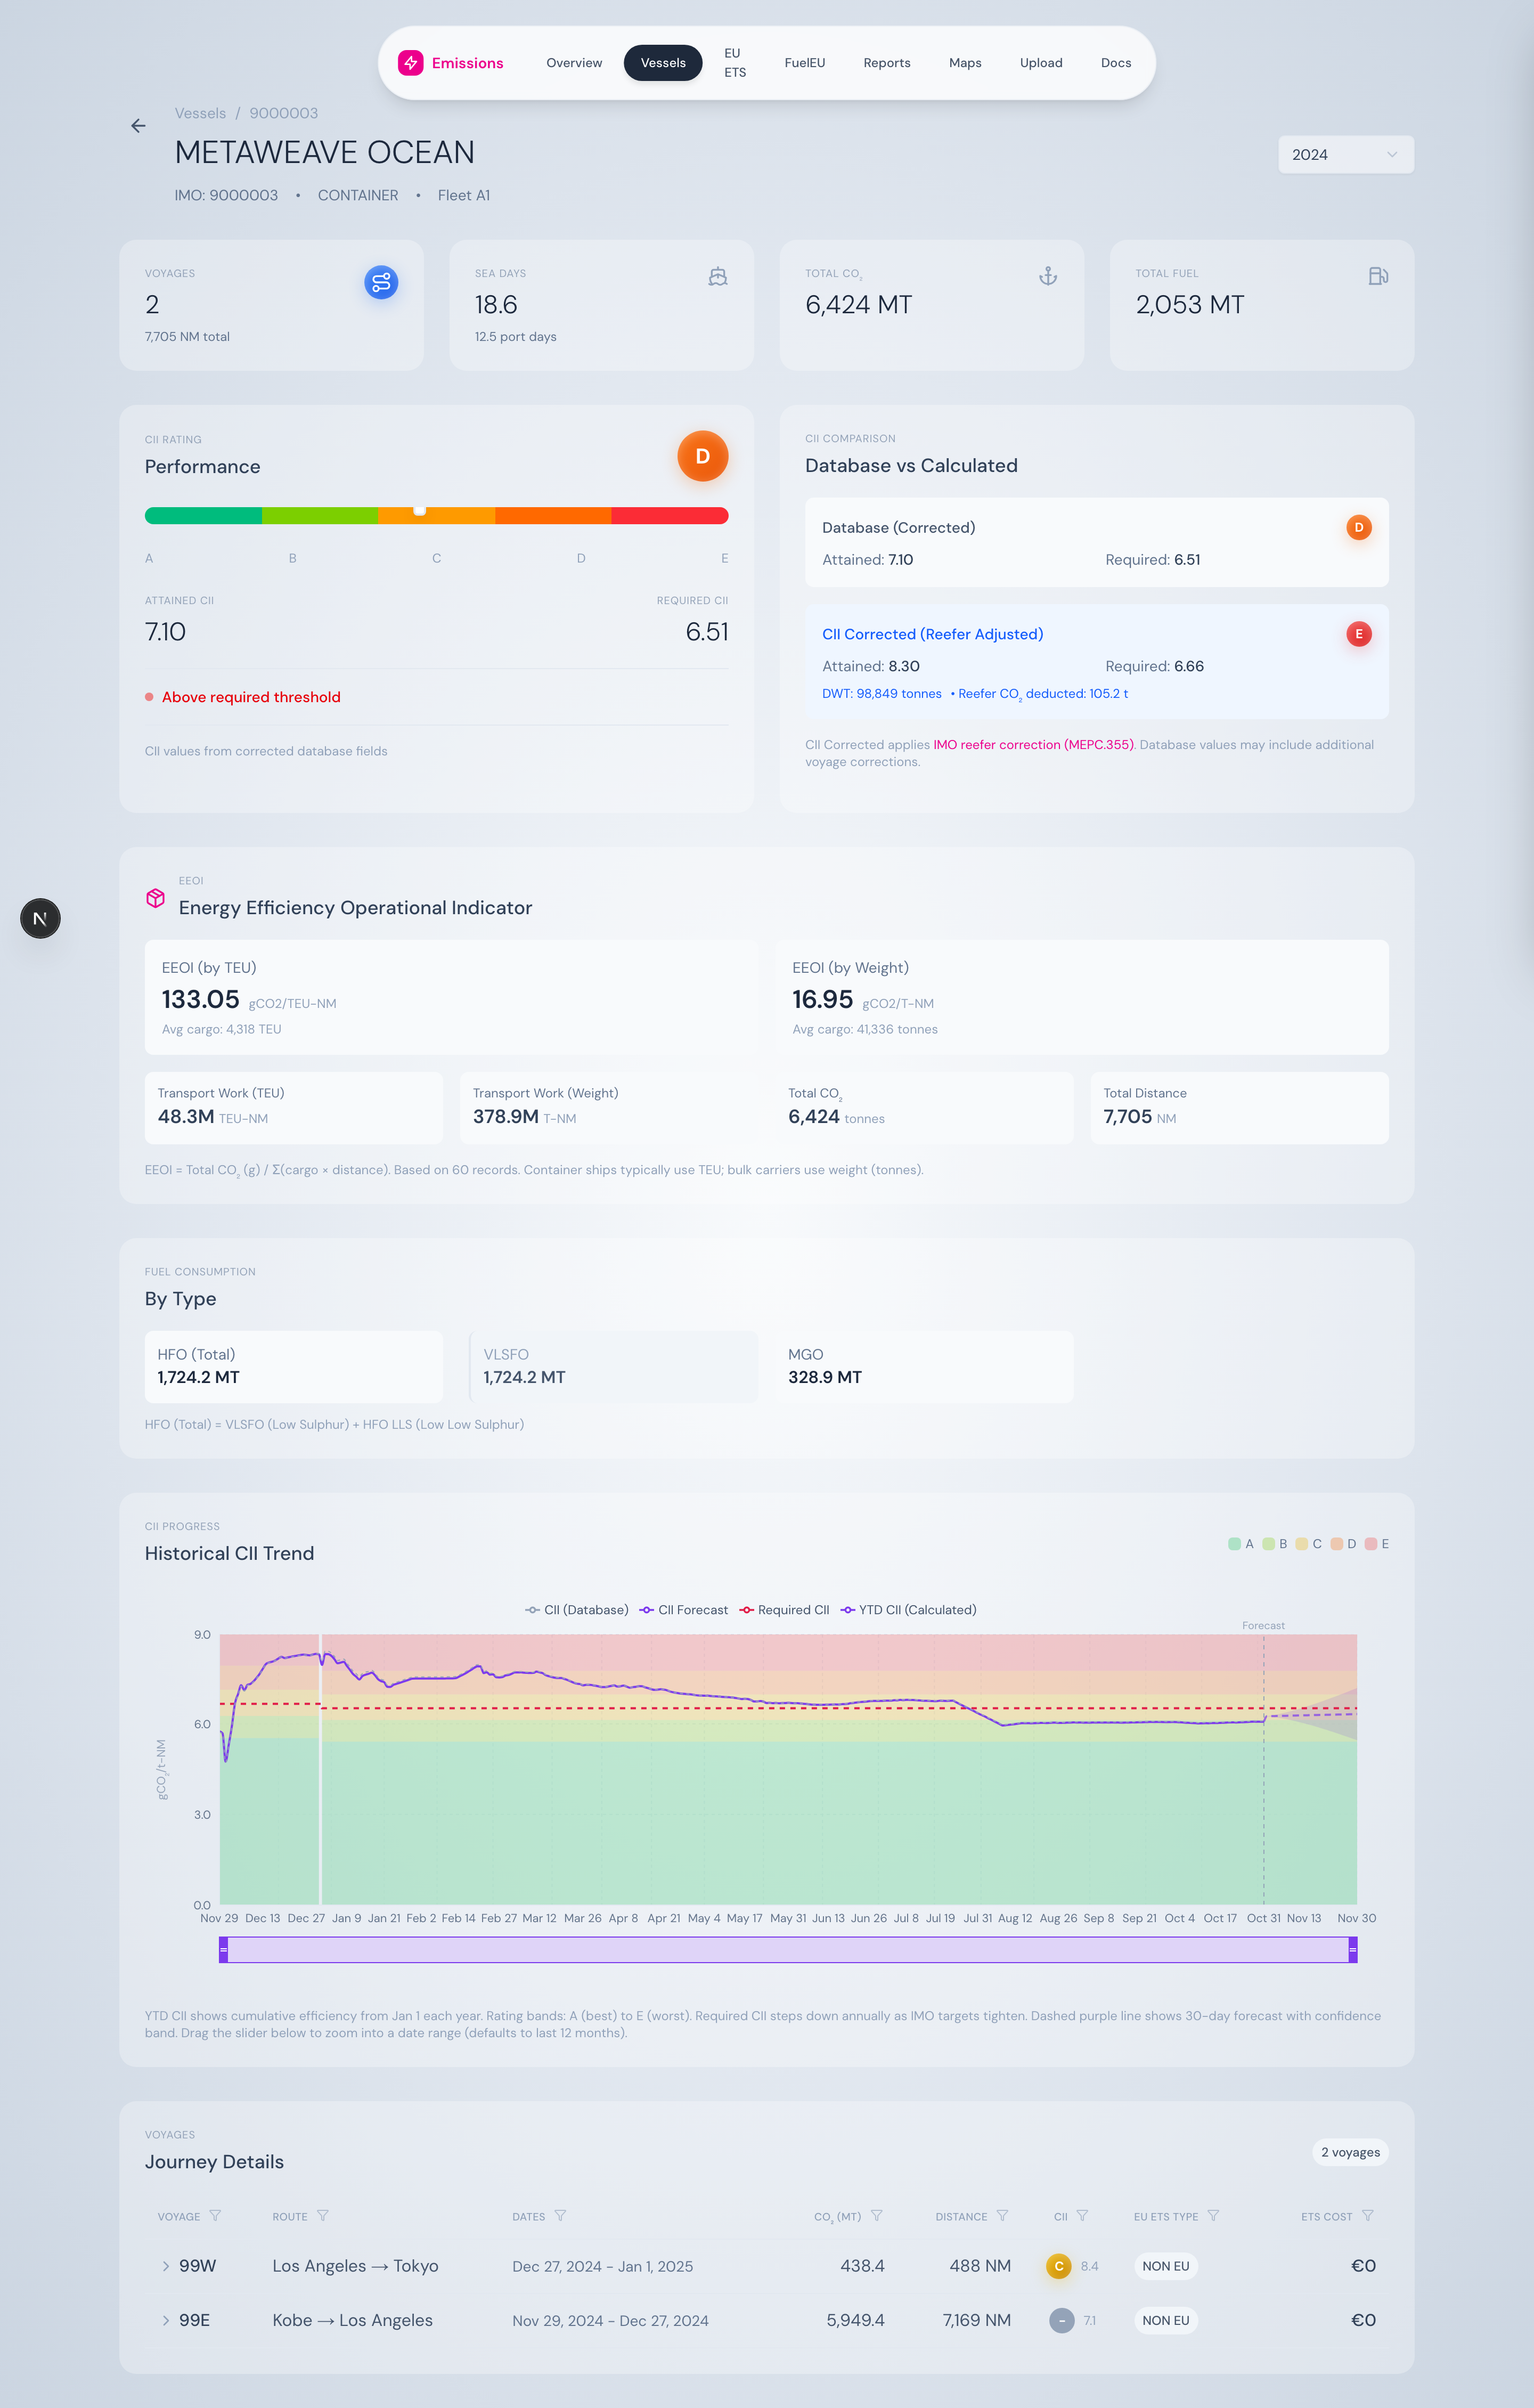
Vessel detail header — name, IMO, type, fleet, year selector.
What’s on the page
Summary cards
Four cards across the top: Voyages (count + total distance), Sea Days (+ port days), Total CO₂, Total Fuel. Each card is one number plus a sub-figure for context.
CII performance
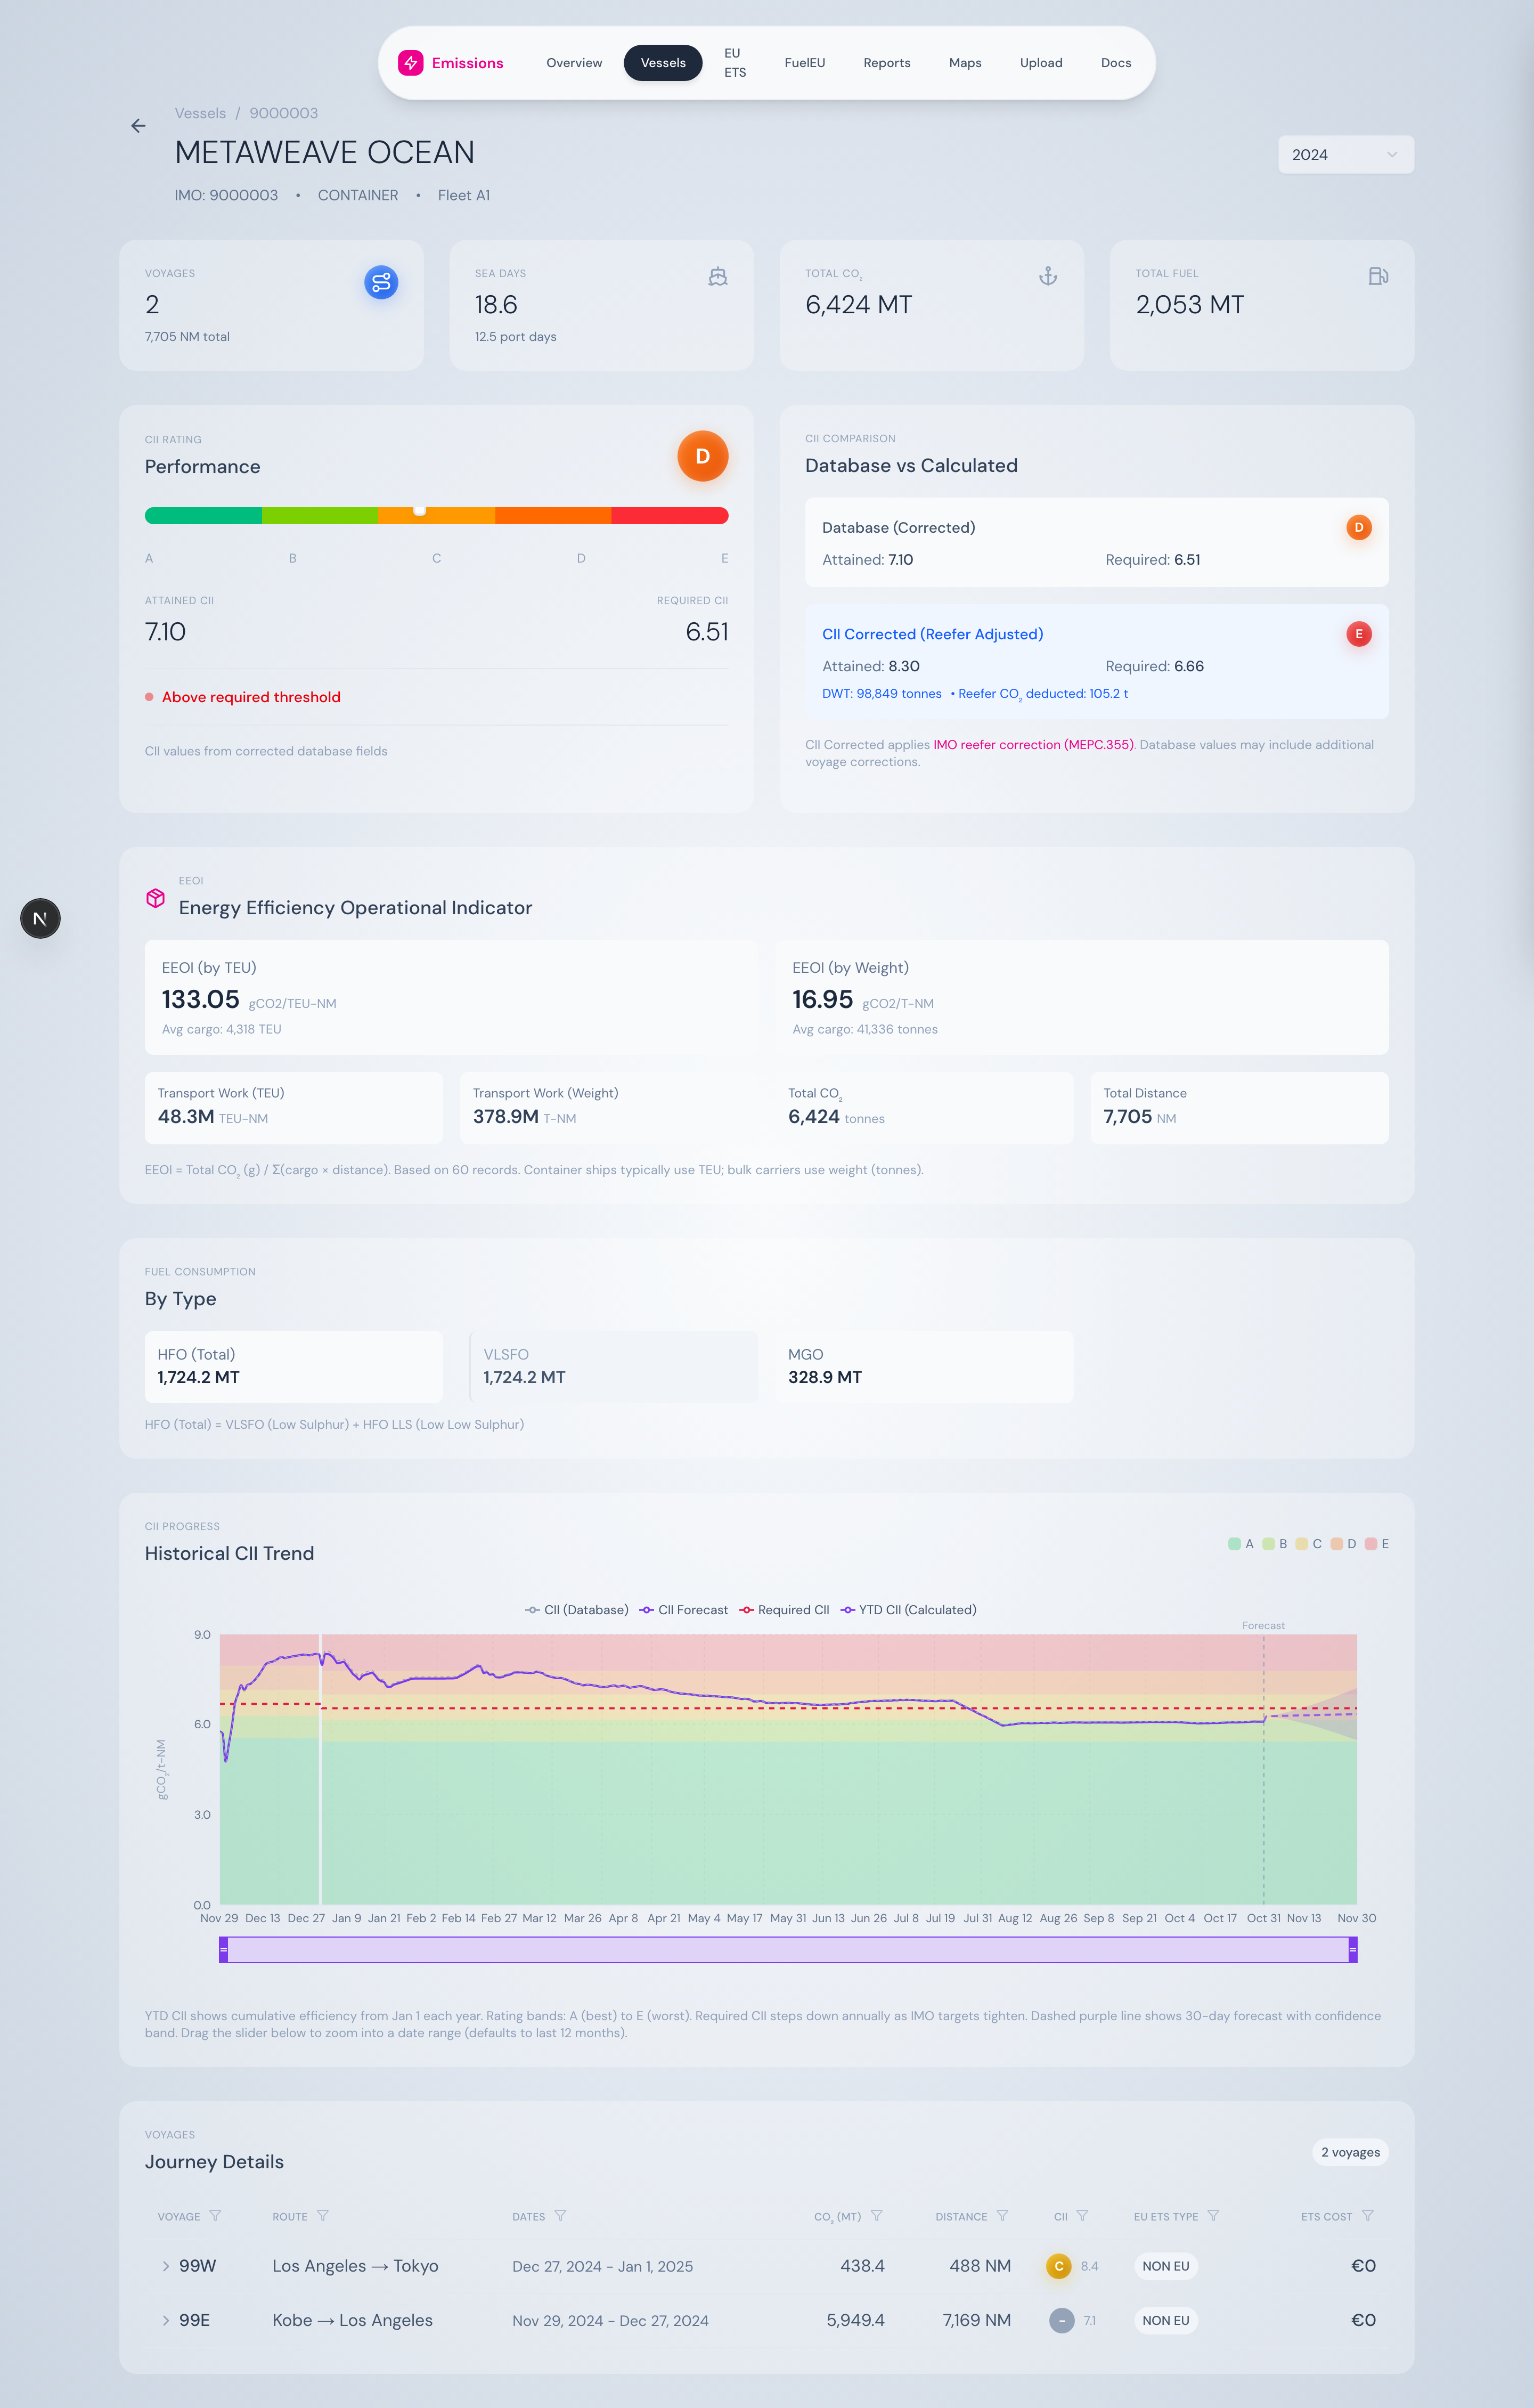
CII gauge with rating bands and a side-by-side comparison of database vs. reefer-corrected CII.
A radial gauge plots Attained CII against the required line, with A/B/C/D/E zones drawn in the background. Next to it, a comparison box shows two CII values:
- Database CII — what’s reported in the consumption logs
- Corrected CII — with reefer container CO₂ stripped out per MEPC.355(78)
A link opens the MEPC.355(78) PDF in an in-app slide-out panel for reference.
EEOI
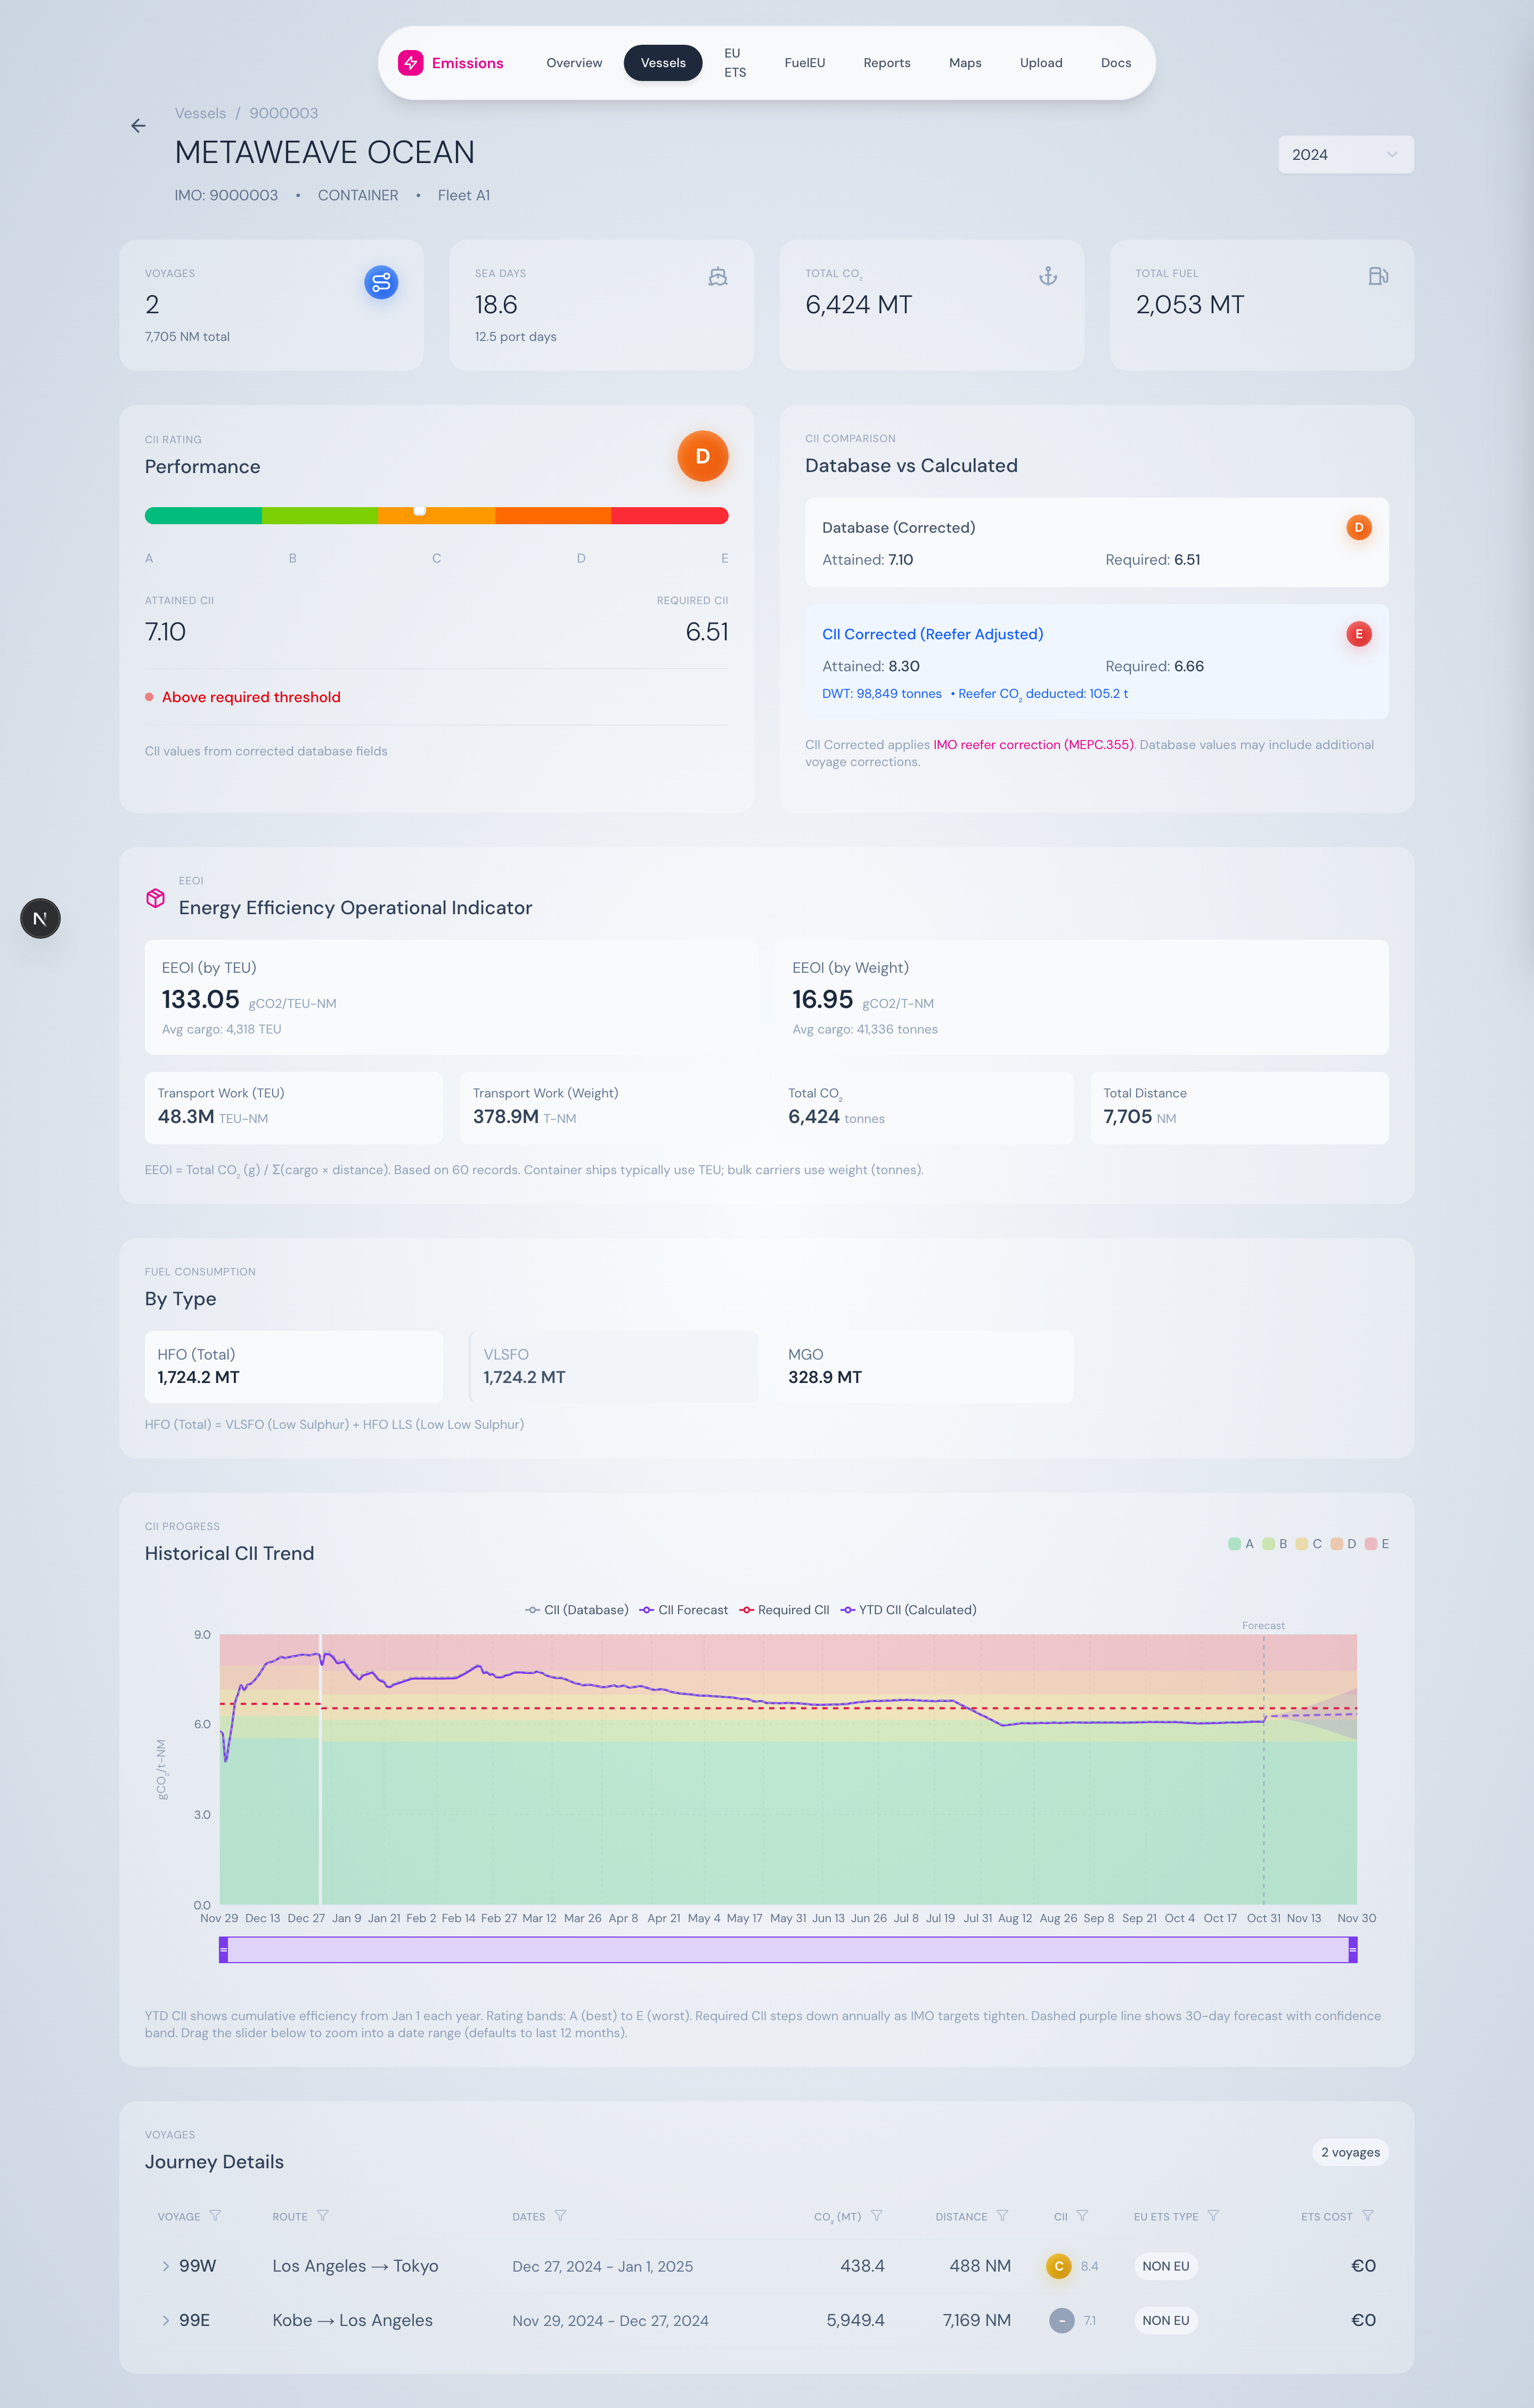
EEOI by TEU and by weight, with supporting transport-work metrics.
Two EEOI numbers, calculated automatically based on ship type:
- EEOI by TEU — gCO₂ / TEU-NM (for container ships)
- EEOI by Weight — gCO₂ / tonne-NM (for bulkers and general cargo)
Plus the underlying transport work, total CO₂, total distance, and average cargo per voyage.
Fuel breakdown
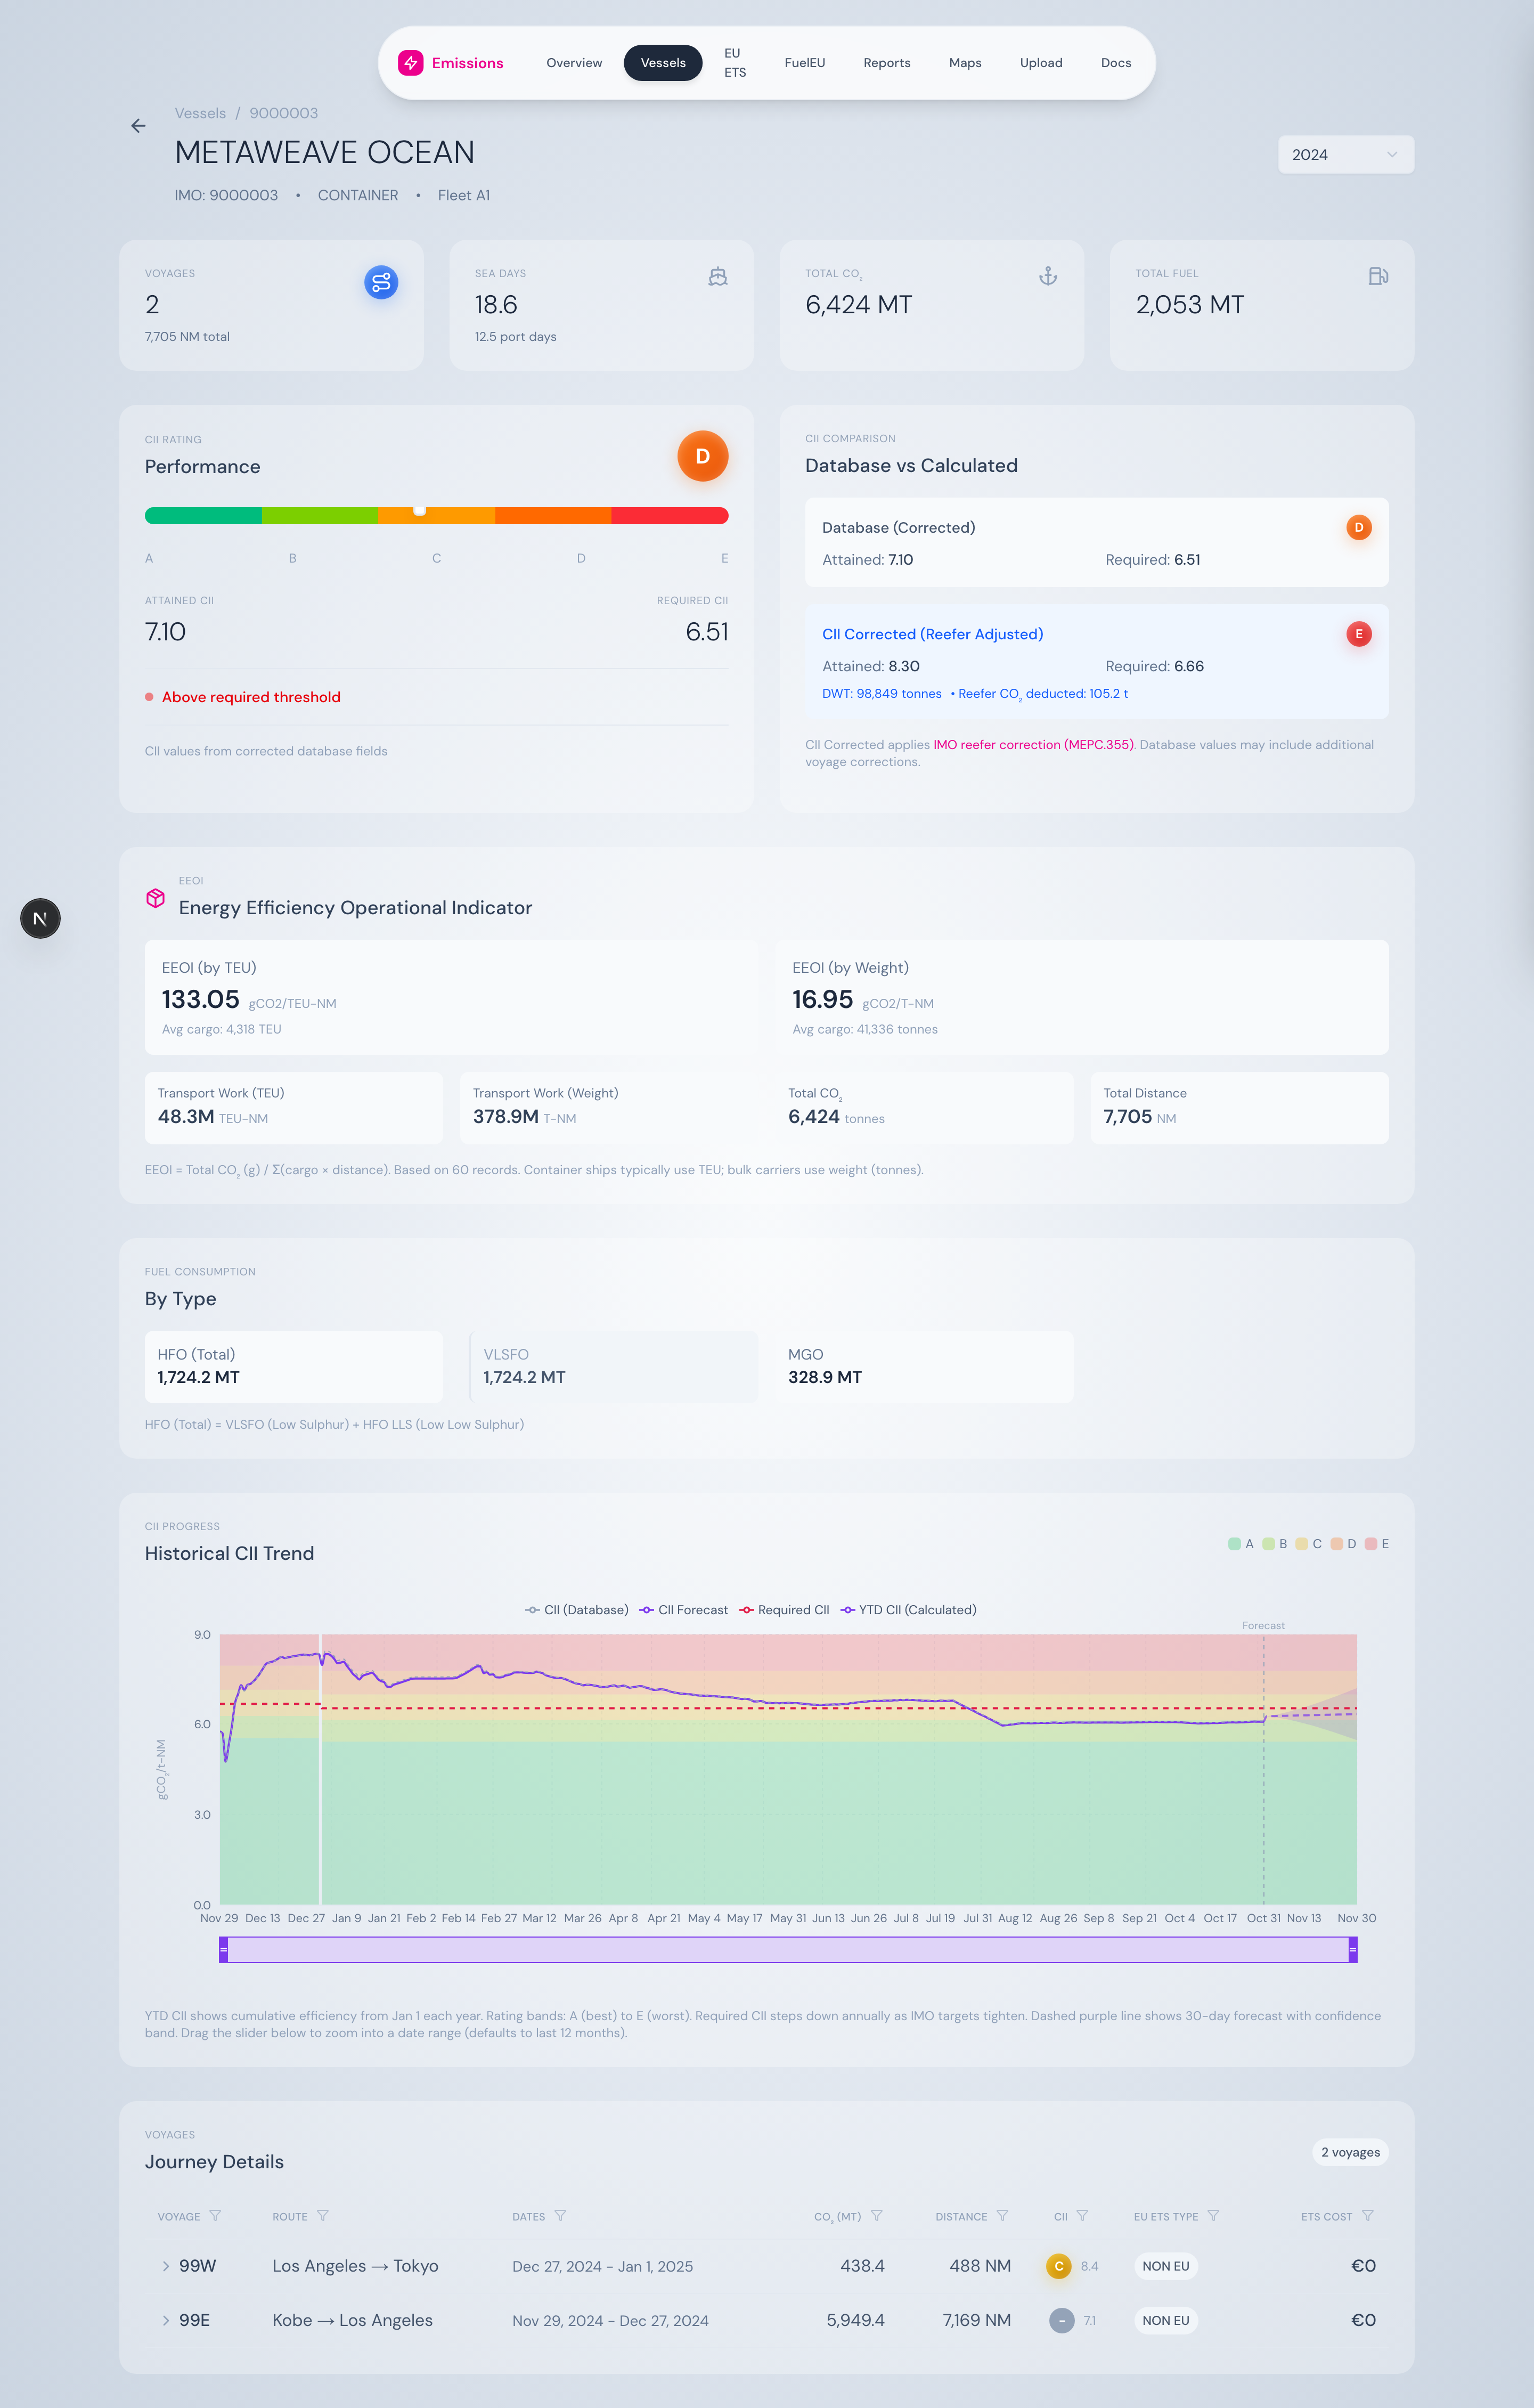
Fuel consumed in the year, hierarchical by fuel category.
Tonnes by fuel type, displayed hierarchically:
- HFO (Total) = VLSFO + HFO LLS
- MDO / MGO
- LNG, Methanol, Biofuel blends, etc.
CII rolling chart
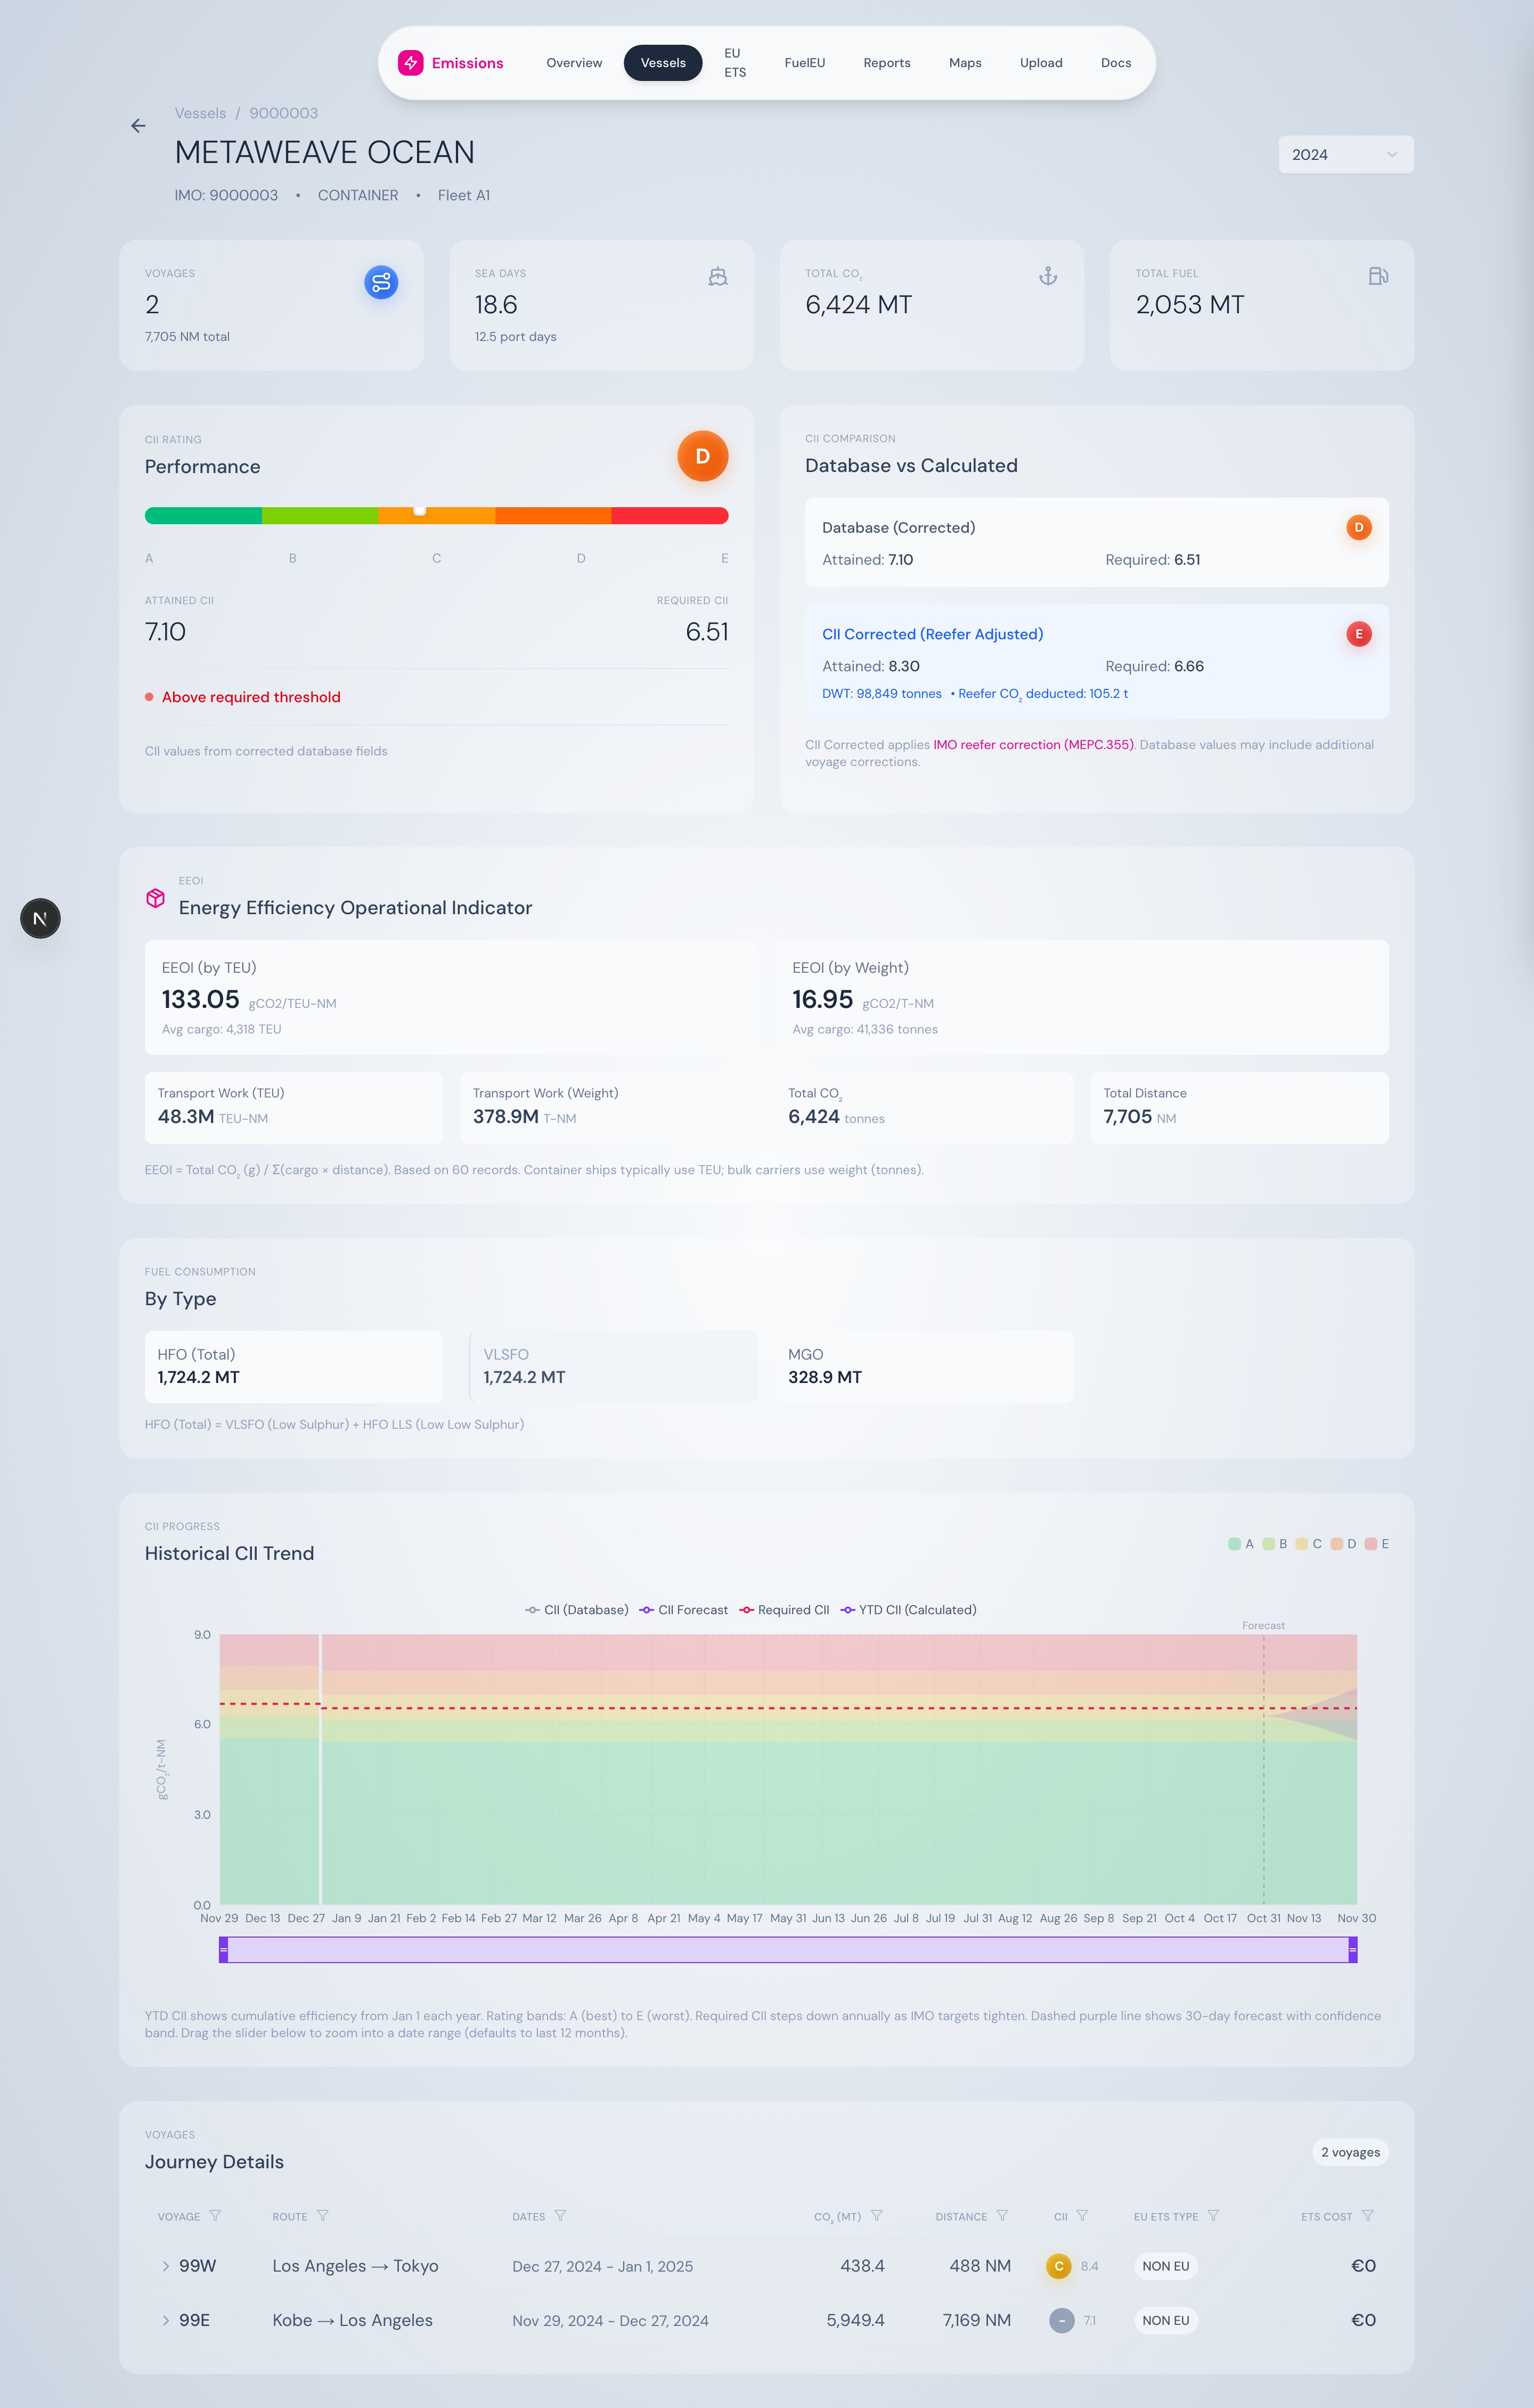
12-month rolling CII chart with required-CII step lines per year and brush-to-zoom.
Daily Attained CII plotted over a multi-year window (2023 → current+1 year by default), with the year’s Required CII as a stepped baseline. Rating bands are drawn as background colours. A brush at the bottom lets you zoom into any date range.
Voyages table — expandable
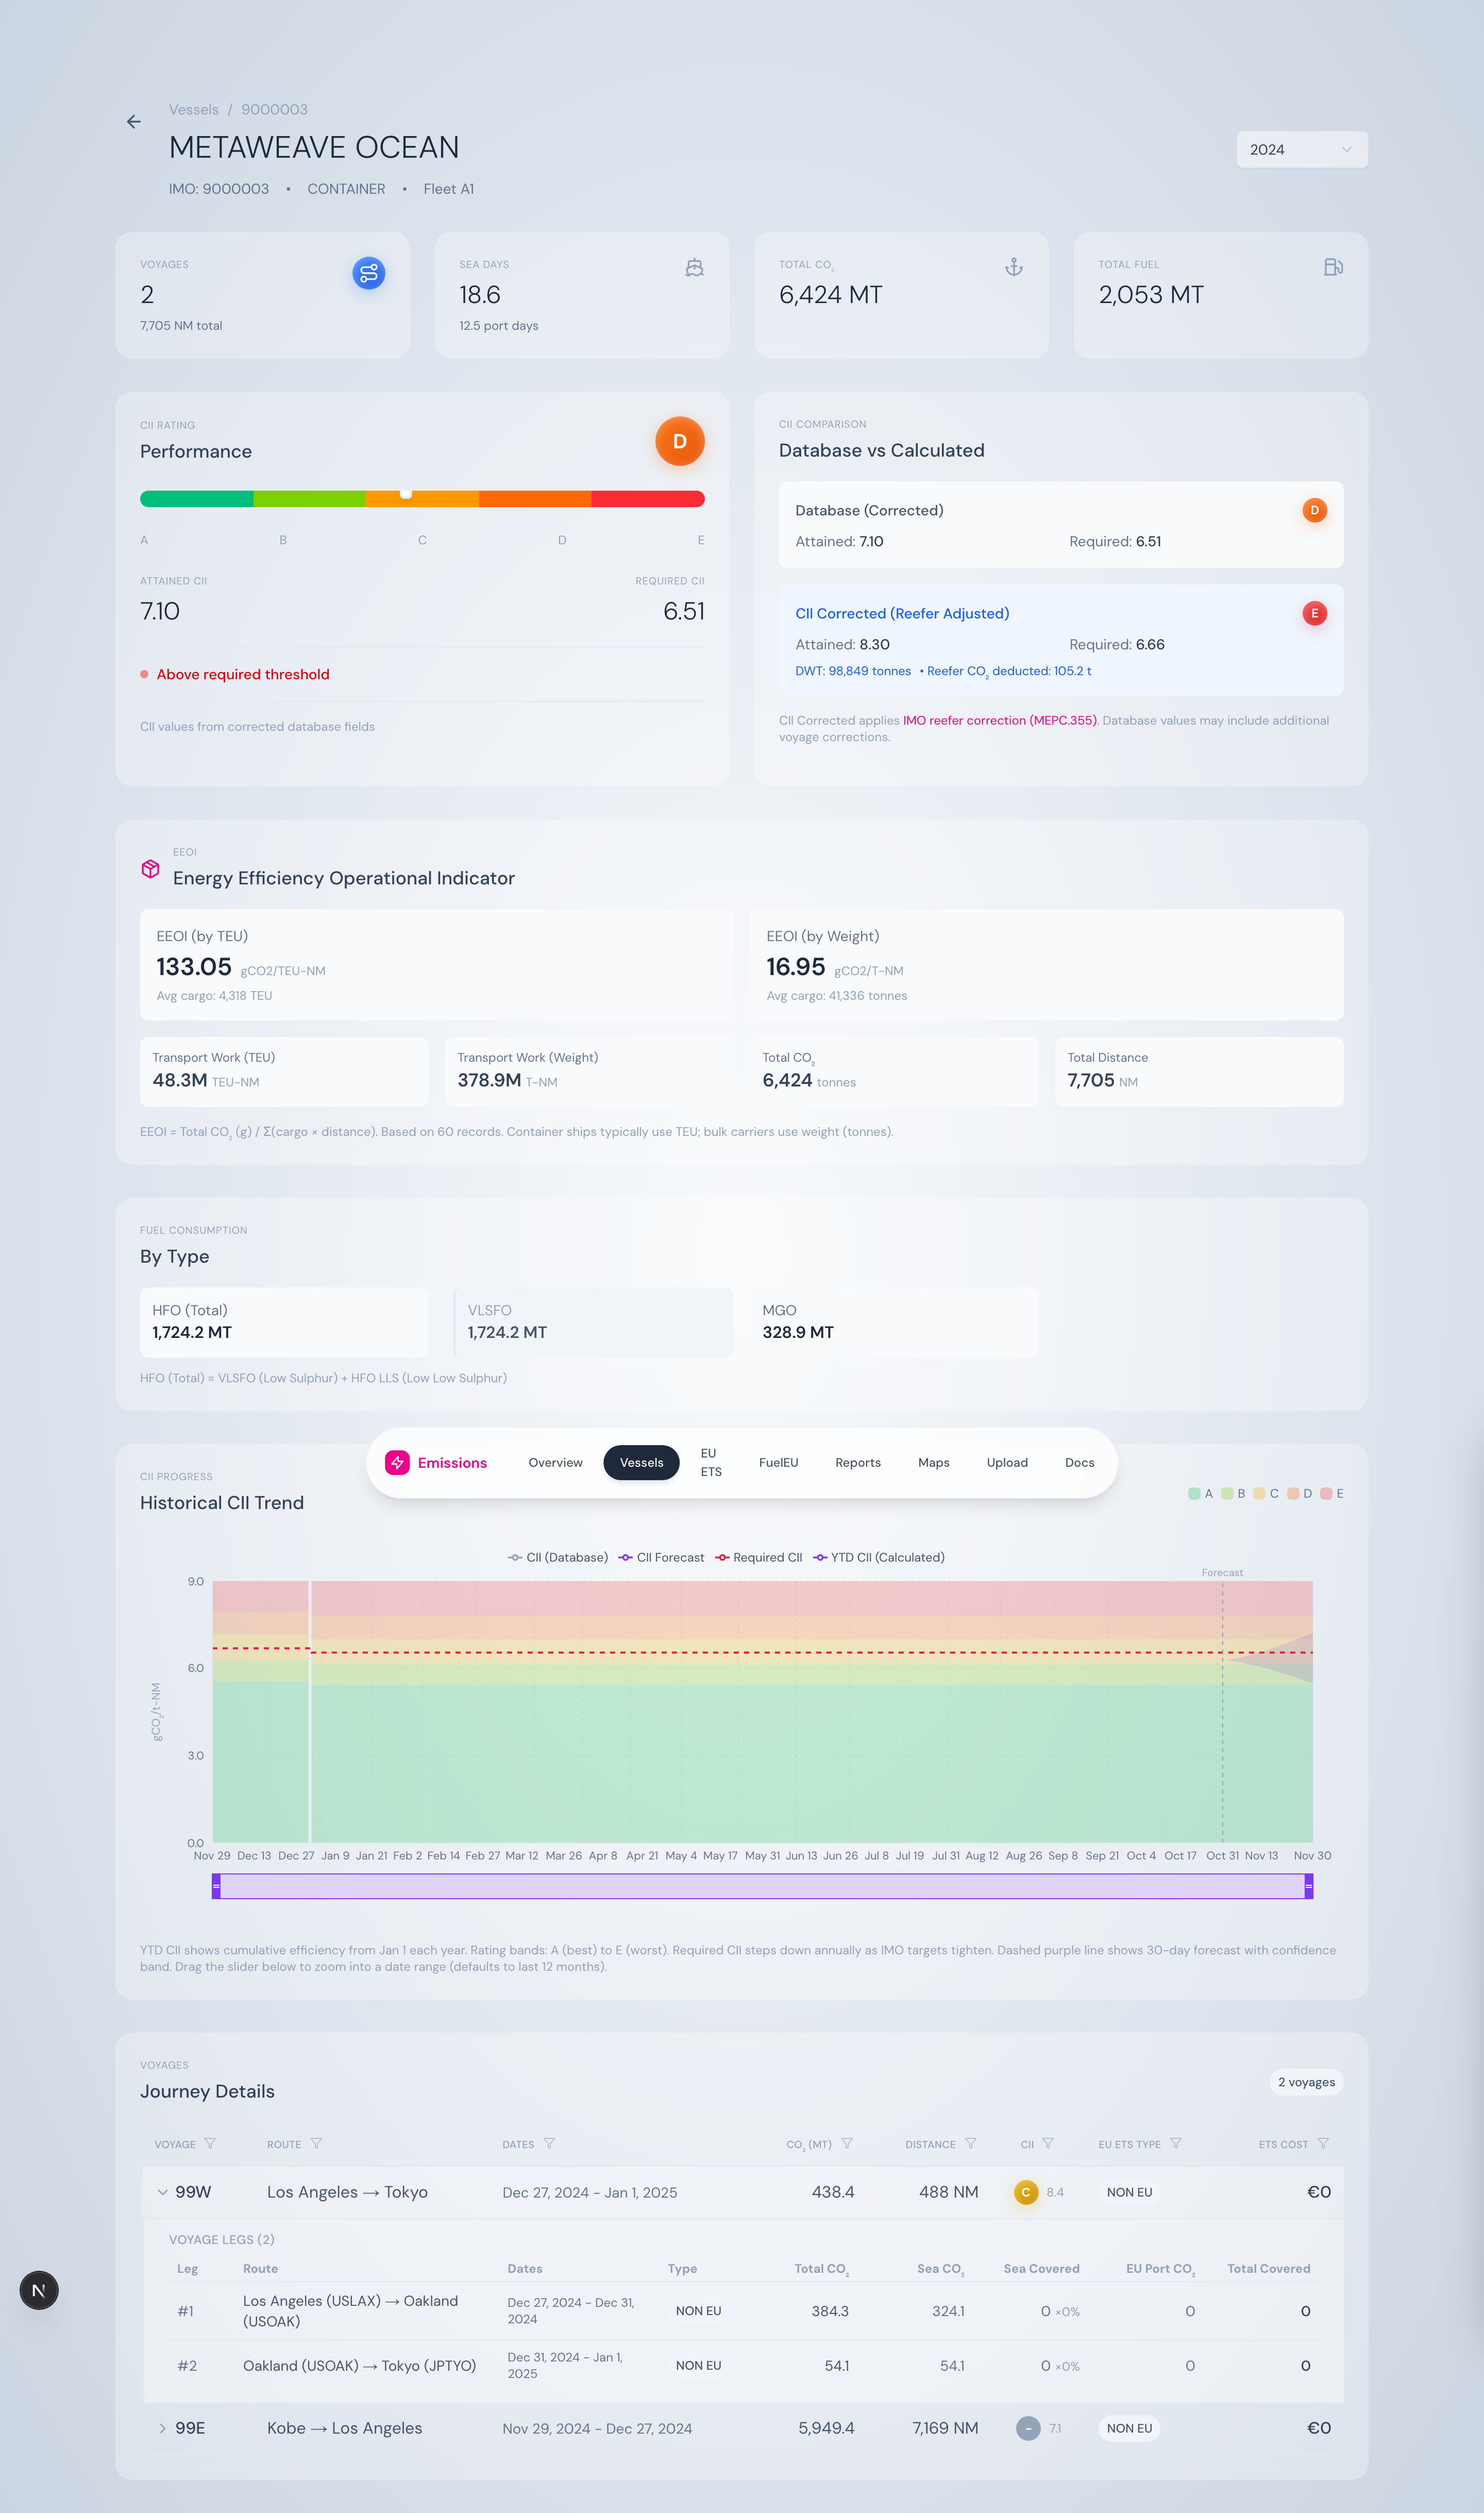
Voyages list, expandable row showing leg-by-leg ETS coverage.
One row per voyage with route, dates, total CO₂, distance, average CII, ETS classification, and ETS cost. Click any row to expand into a sub-table of legs:
- Leg # and route (port → port)
- Sea CO₂, sea-covered (with coverage %), EU port CO₂, total covered
- ETS coverage factor applied per leg
This is the most detailed view of how the EU ETS bill is built up for each vessel.
What you can do here
- See exactly which voyage and which leg generated each tonne of covered CO₂
- Compare attained CII trends against the required threshold over time
- Verify that reefer correction has been applied correctly
- Pick a year and see the year-end picture, or use YTD for live monitoring
- Use the breadcrumb to jump back to the fleet view
Source
Powered by /api/vessels/[imo], /api/vessels/[imo]/cii-daily, and /api/vessels/[imo]/voyages. Business logic in VoyageSegmentService and FleetService.