5-minute tour
このコンテンツはまだ日本語訳がありません。
This tour shows what an evaluator typically looks at first. It assumes you already have data loaded for at least one vessel and one year; if not, jump to Excel upload format first.
-
Pick a year
The year selector in the header drives every page in the app. Choose any year that has data — or stay on the current year and toggle YTD for year-to-date.
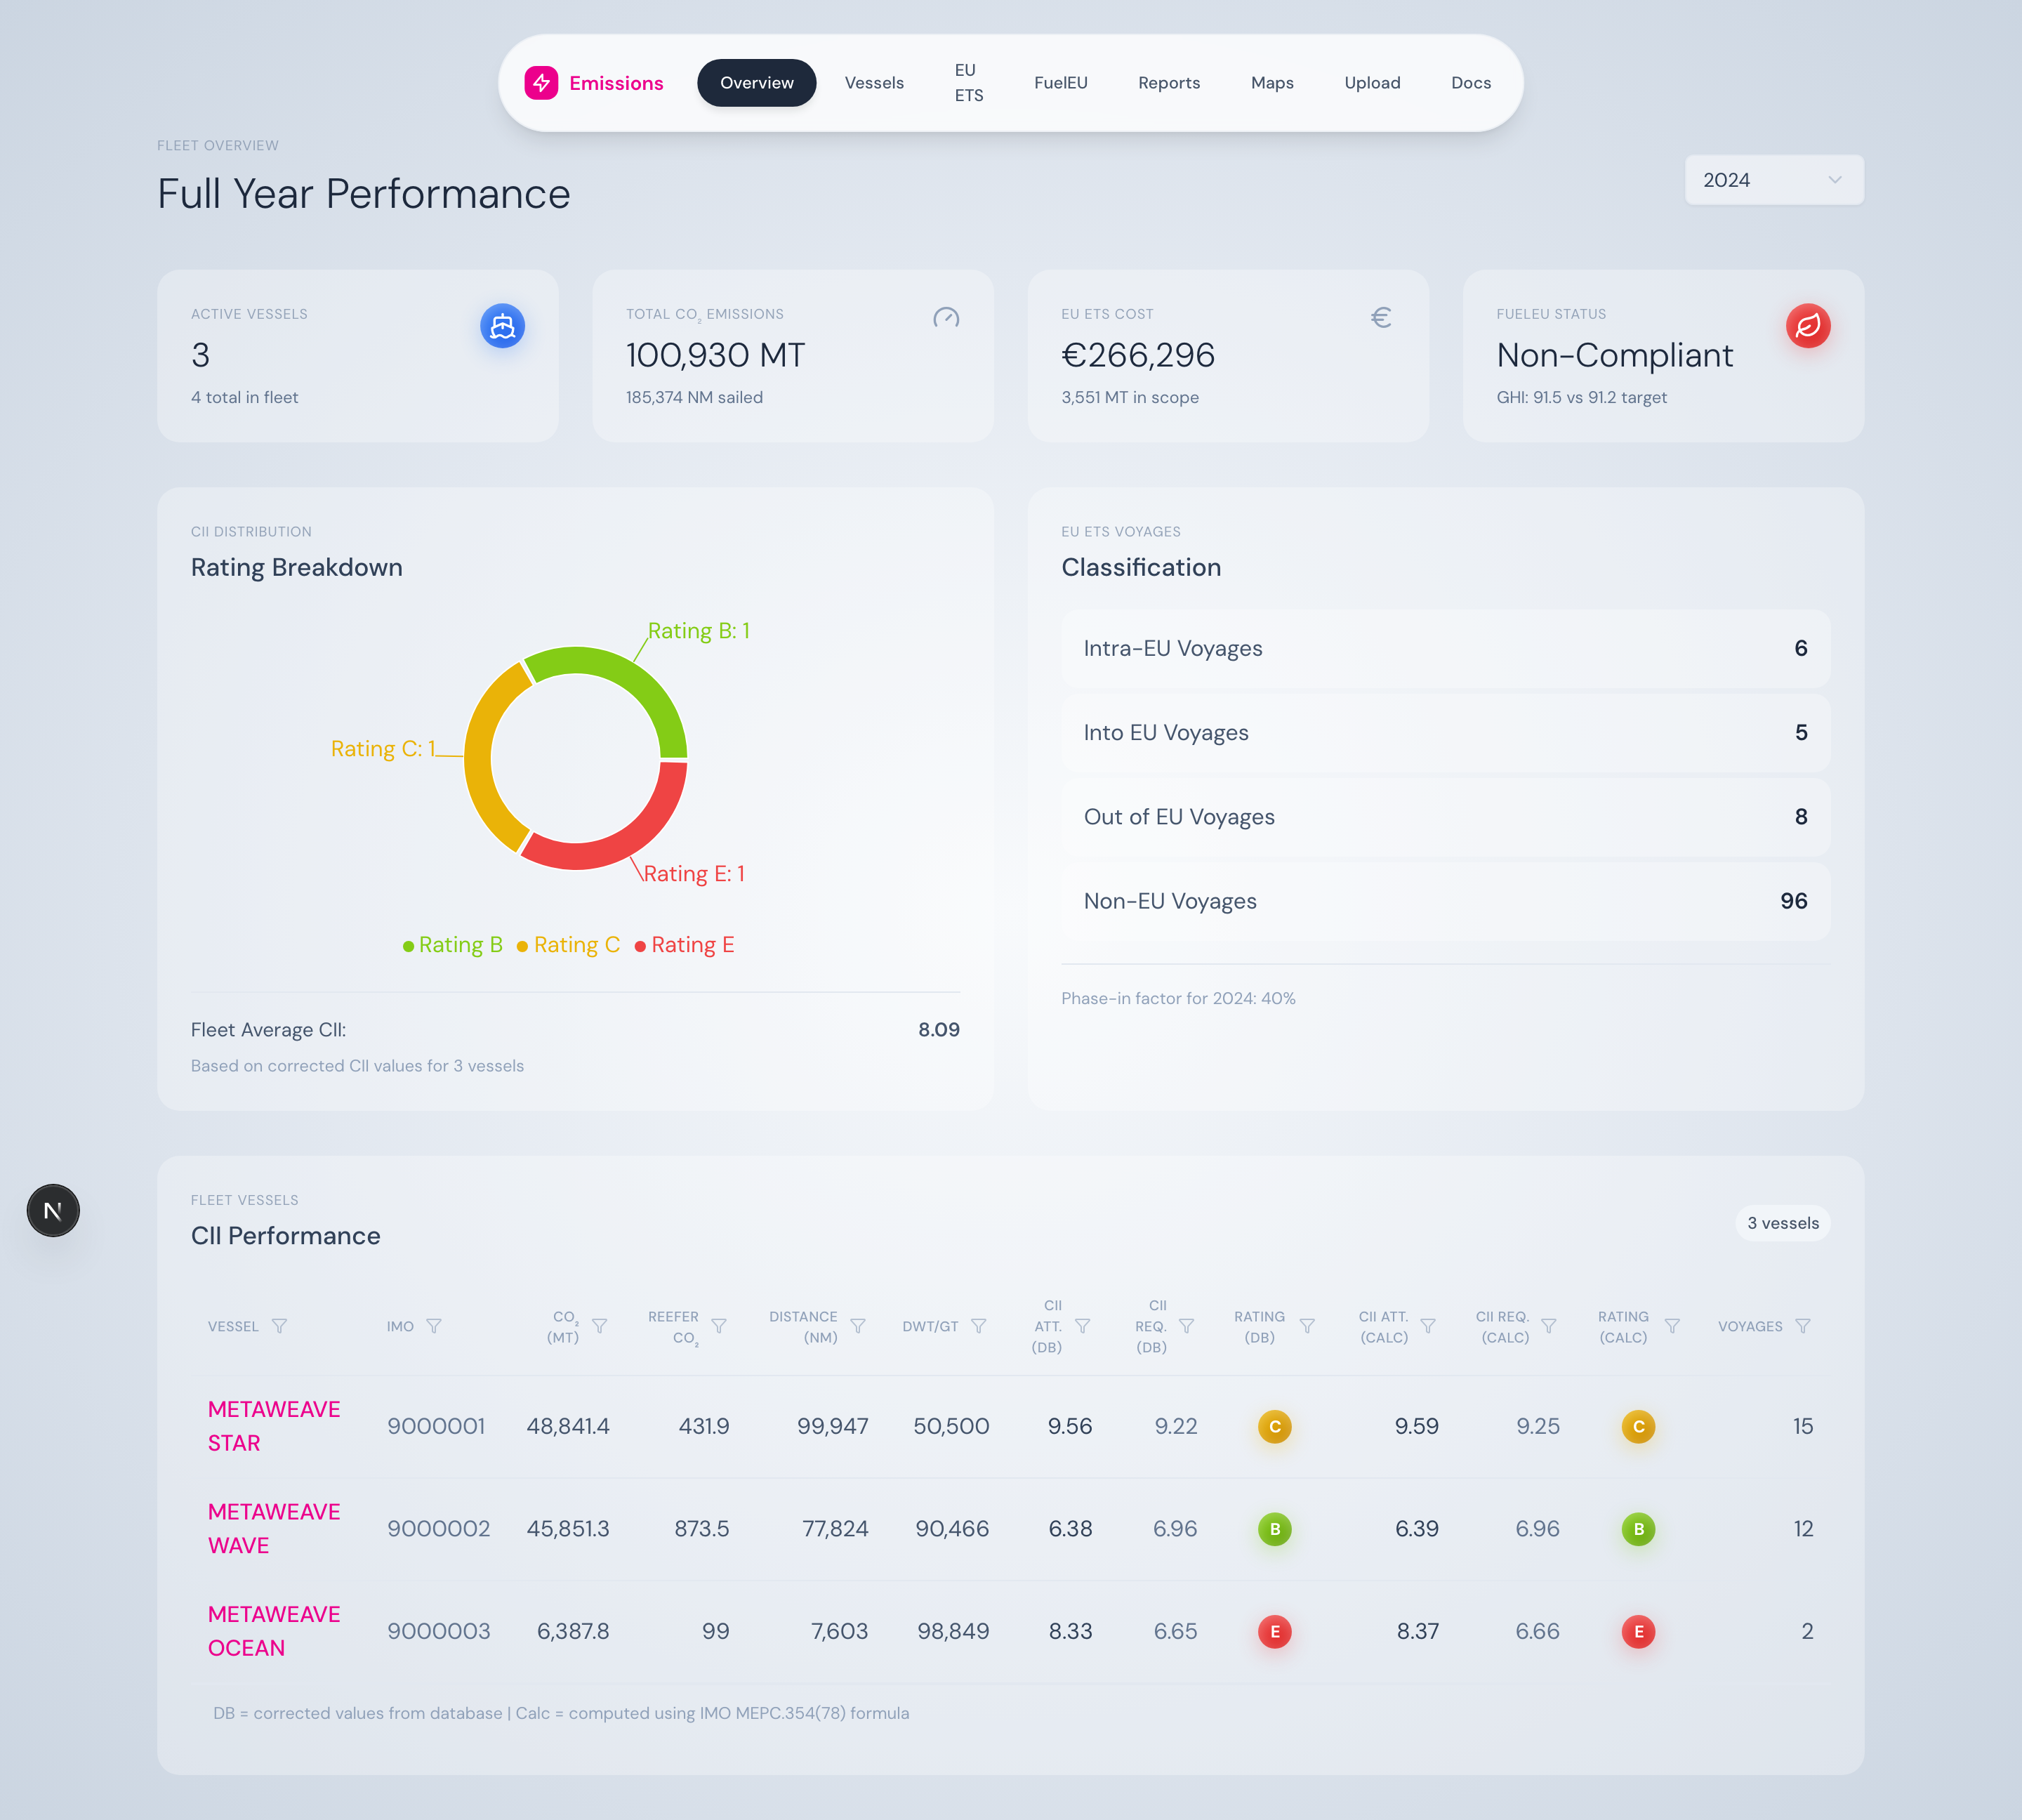
Year selector with YTD toggle for the current year.
-
Read the fleet at a glance
The home page tells you four things instantly: how many vessels reported, total CO₂, EU ETS cost so far, and FuelEU compliance status — plus the A–E distribution across the fleet.
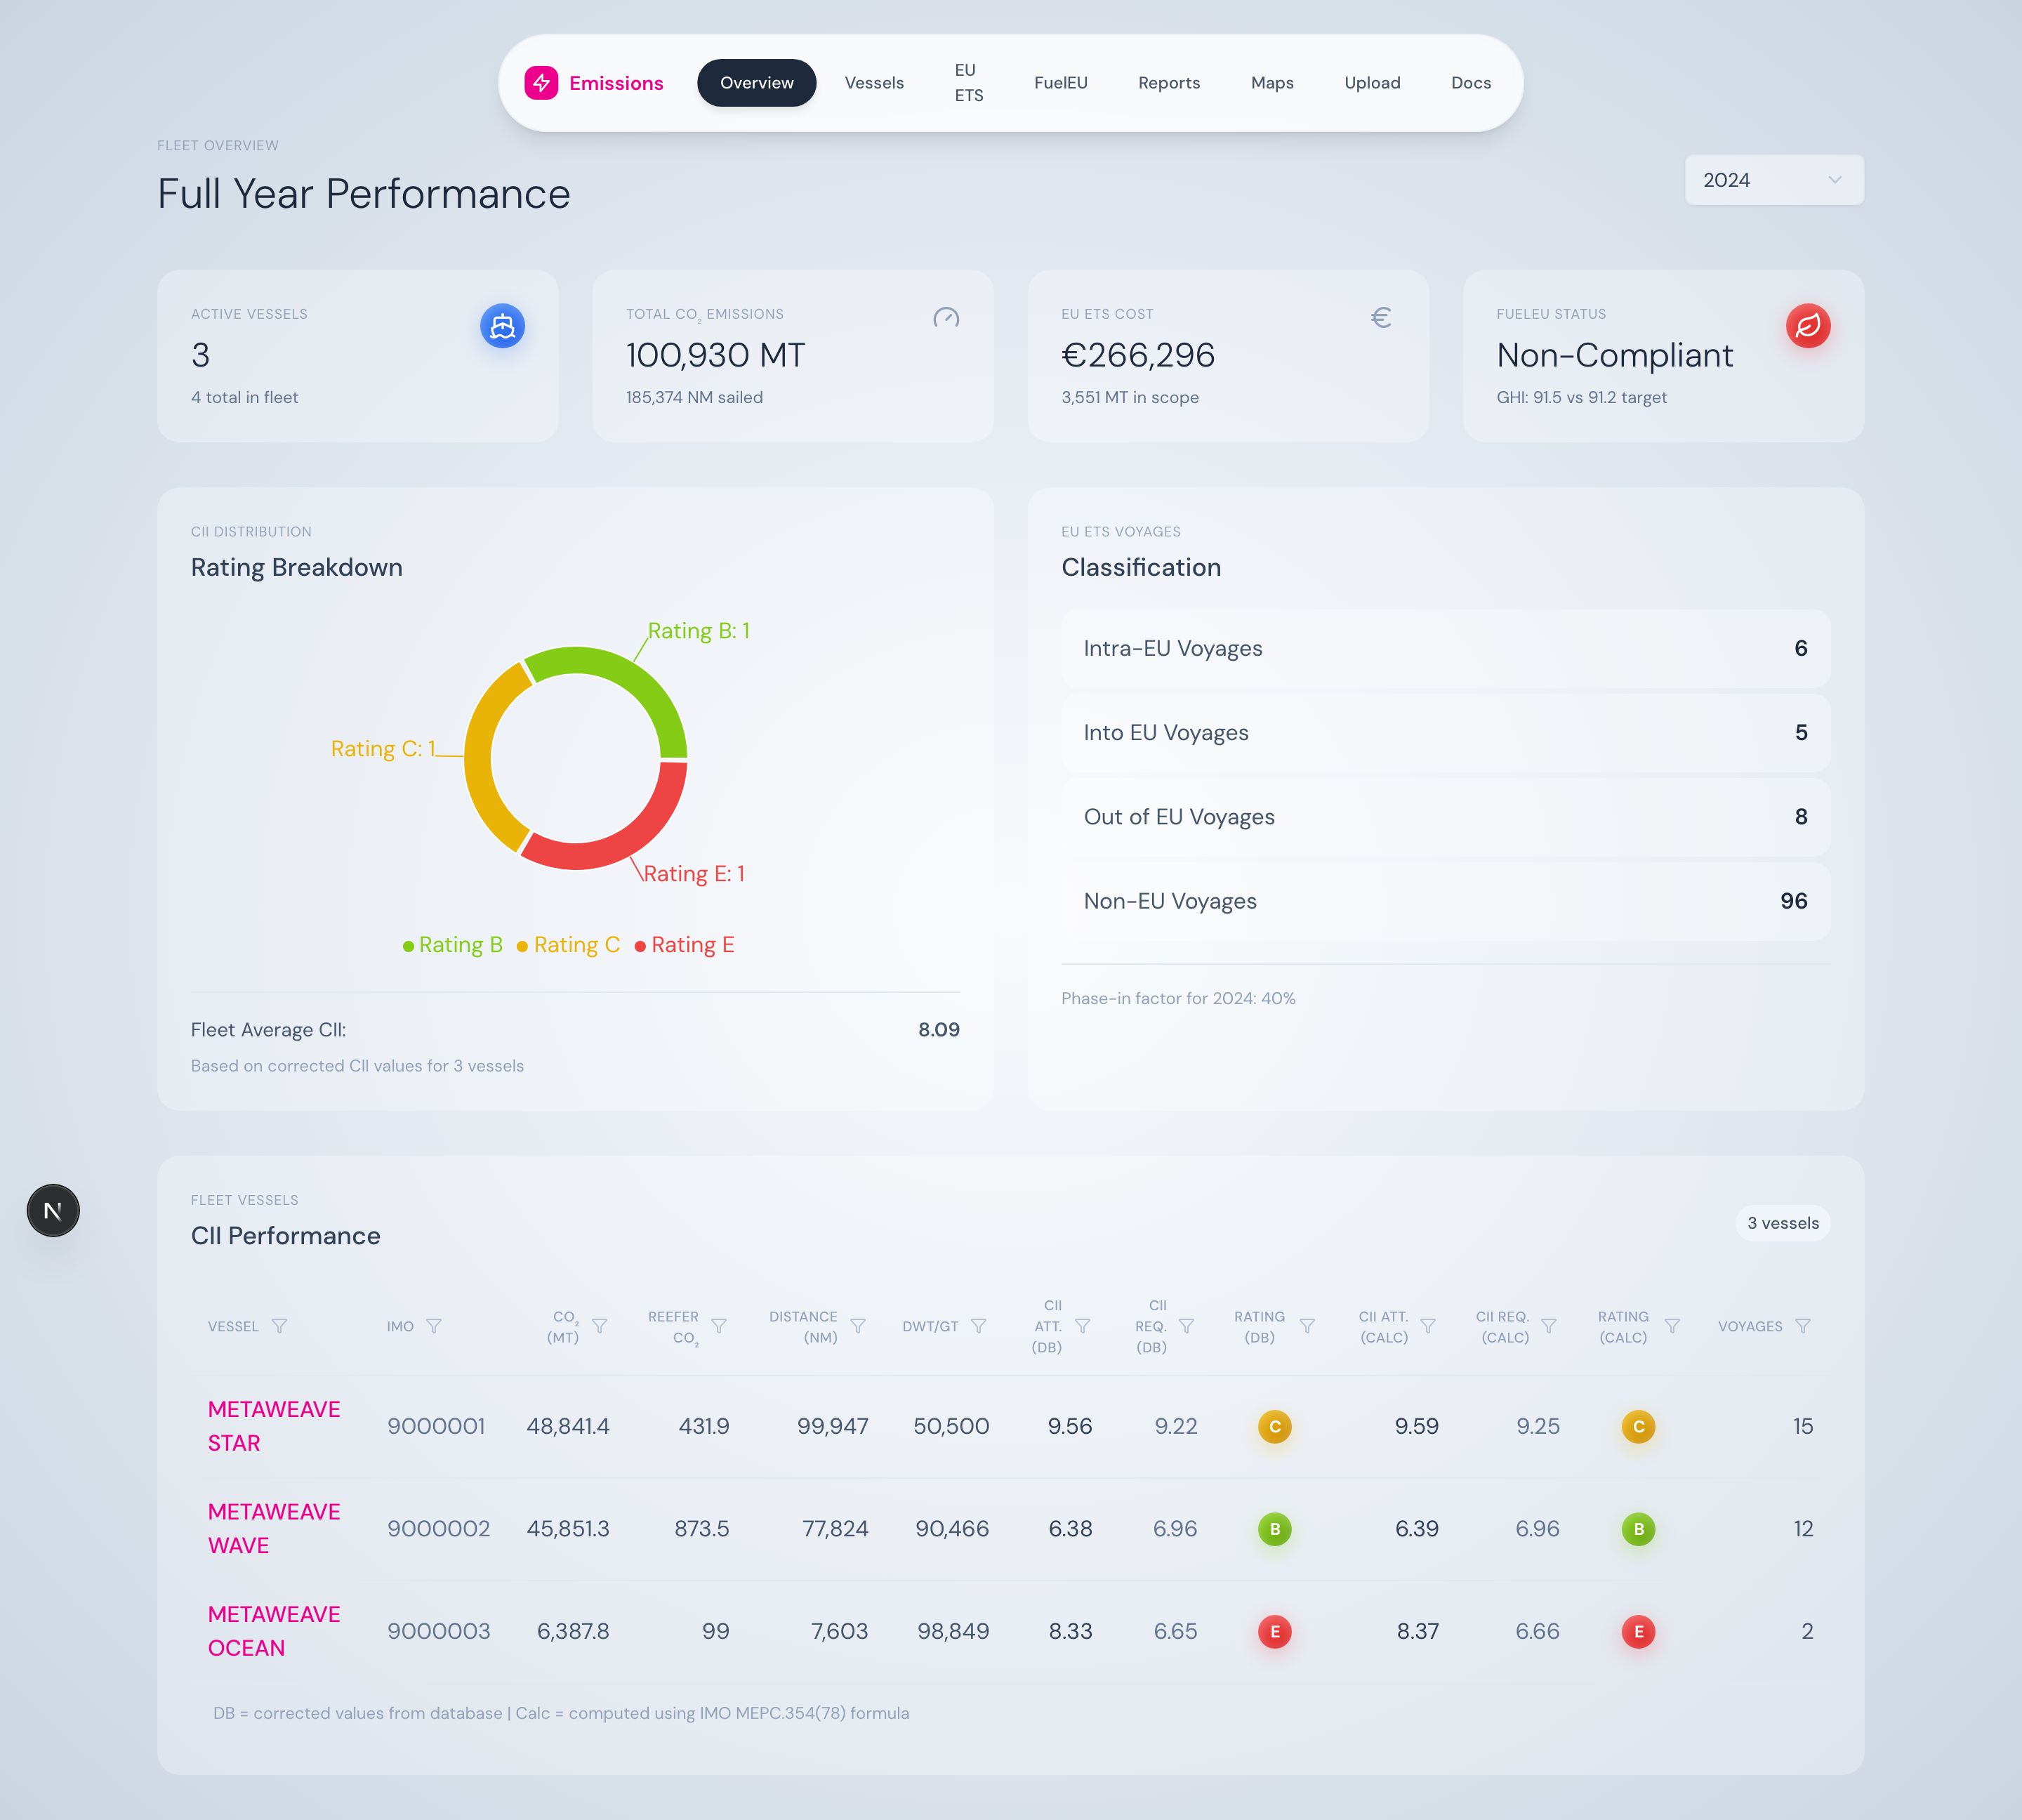
Four summary cards plus the CII A–E distribution.
-
Drill into a vessel
Click any row in the fleet table. The vessel page shows a CII gauge, EEOI by TEU and by weight, fuel breakdown, and a 12-month rolling chart with required CII step lines.
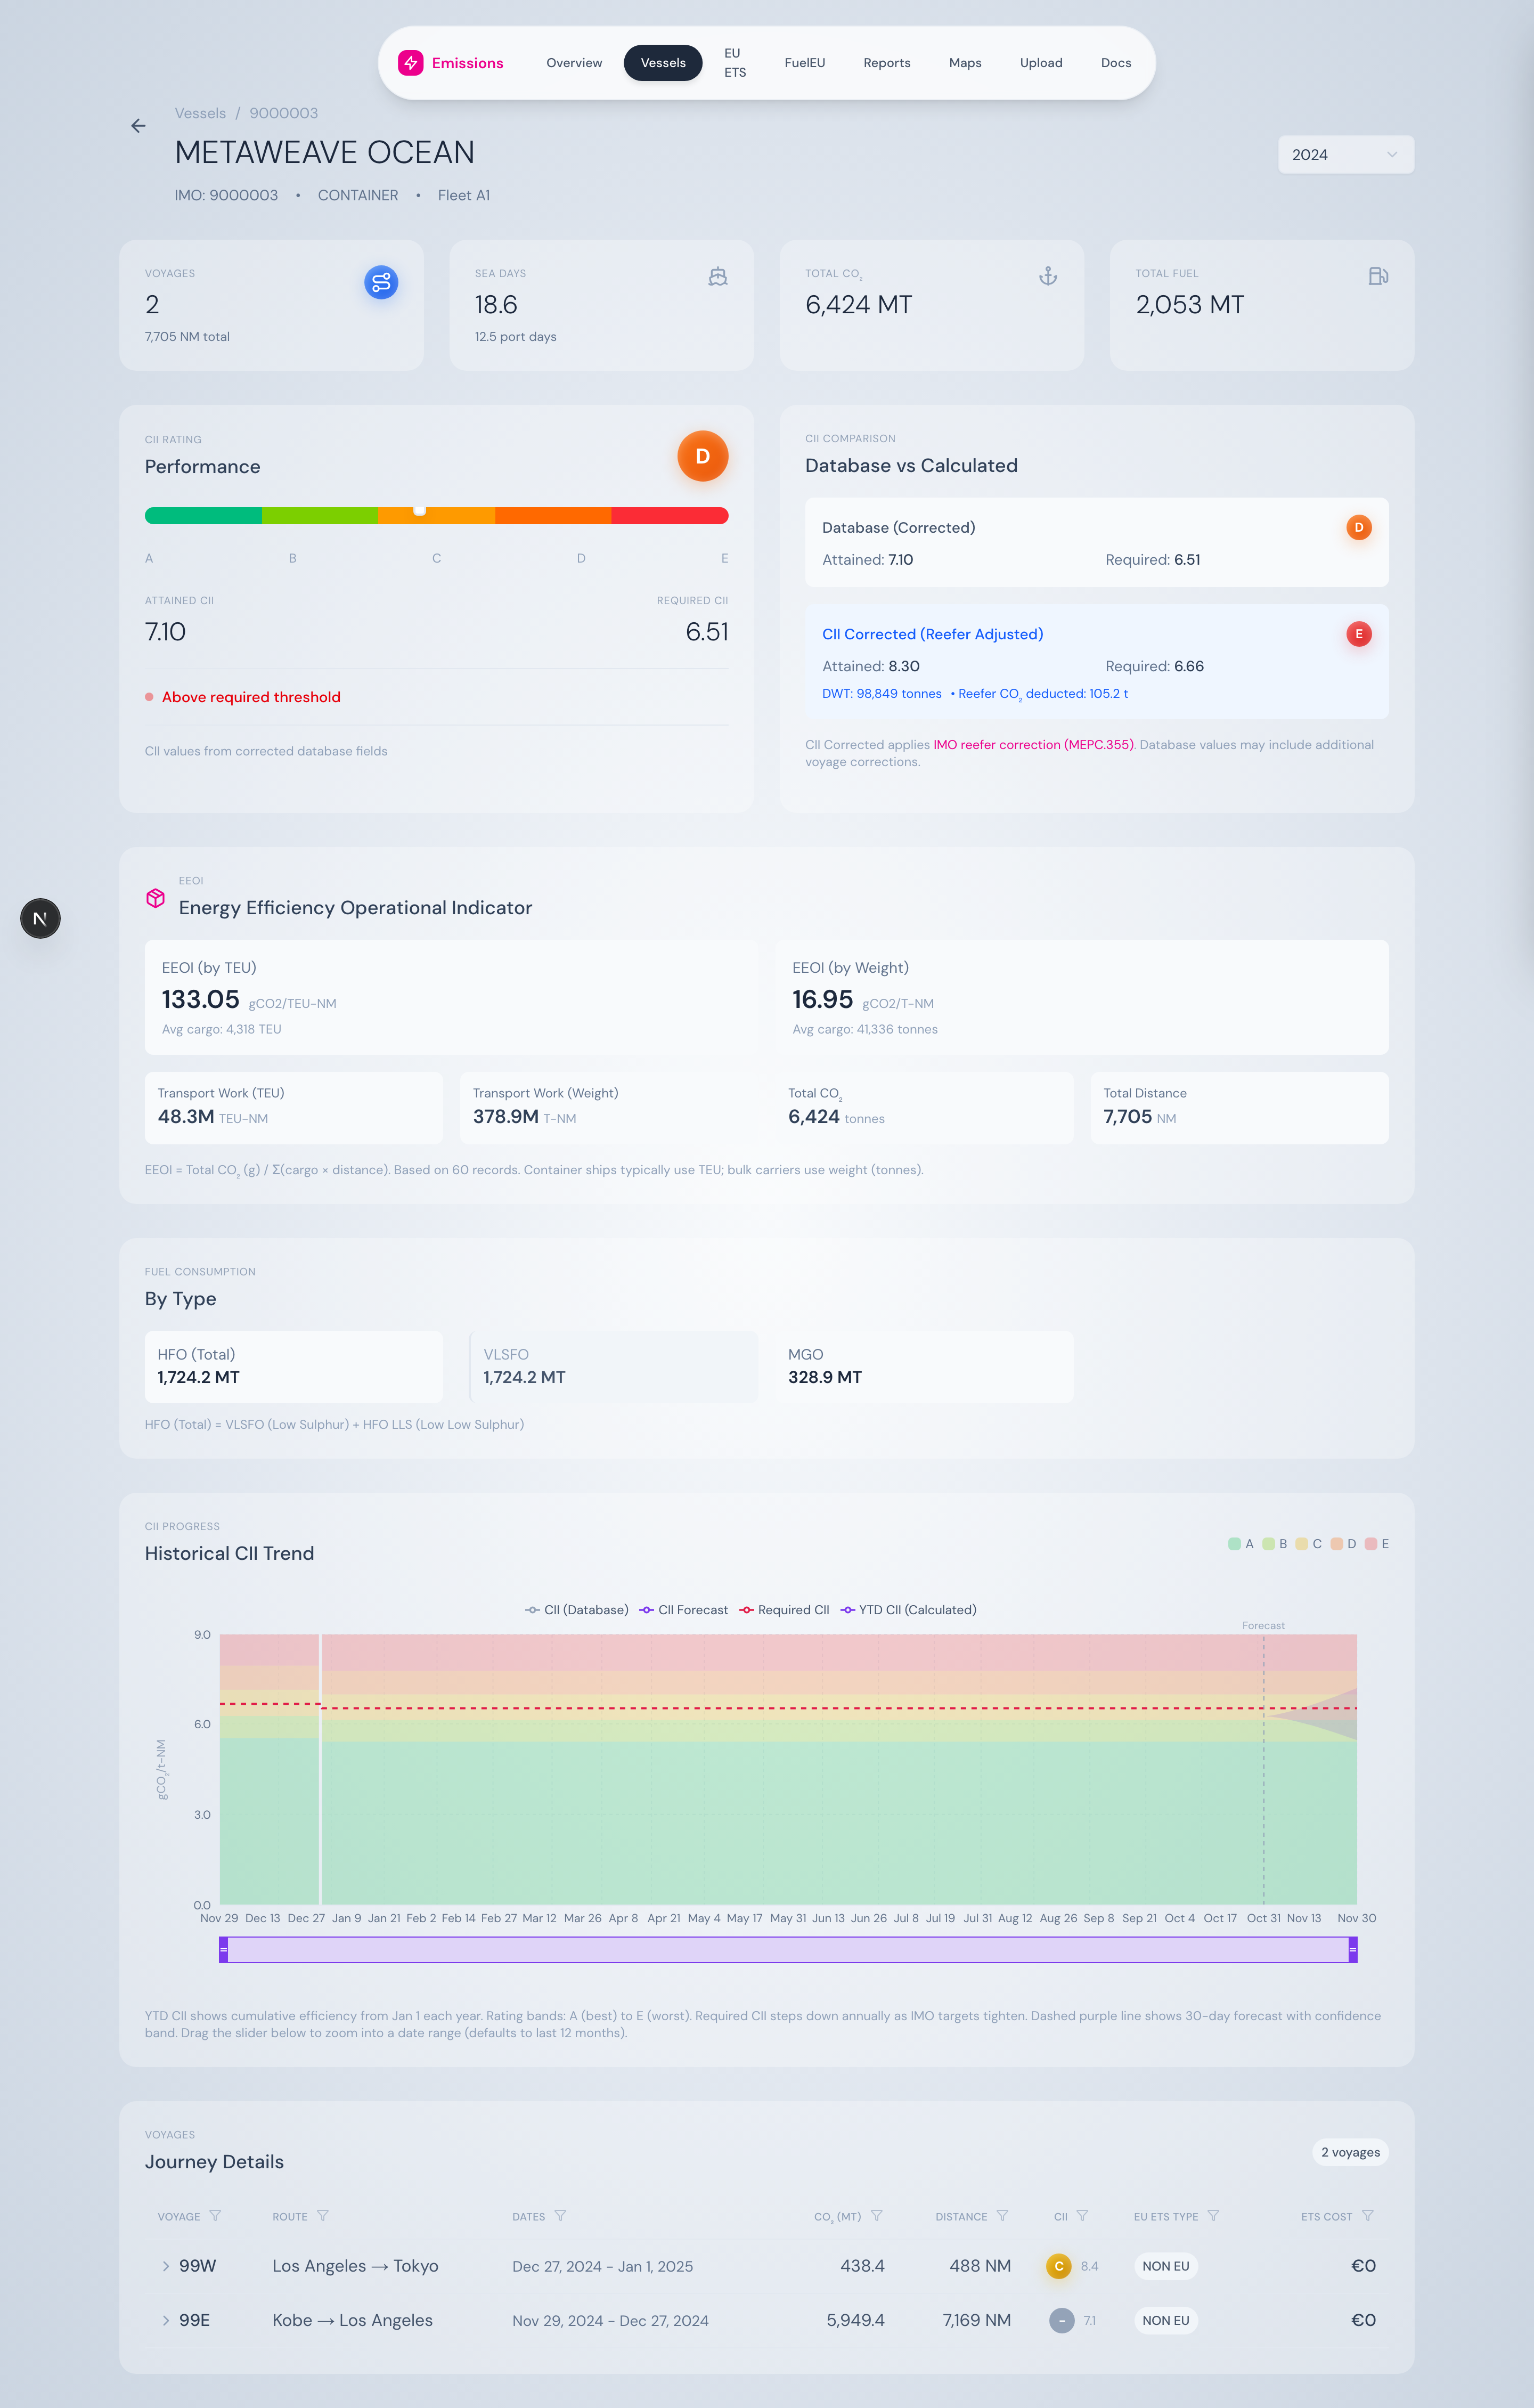
Vessel detail — CII gauge, comparison box, and rolling chart.
-
Expand a voyage
The voyages table on the vessel page is expandable. Click a row to see the leg-by-leg breakdown with EU ETS coverage applied to each segment.
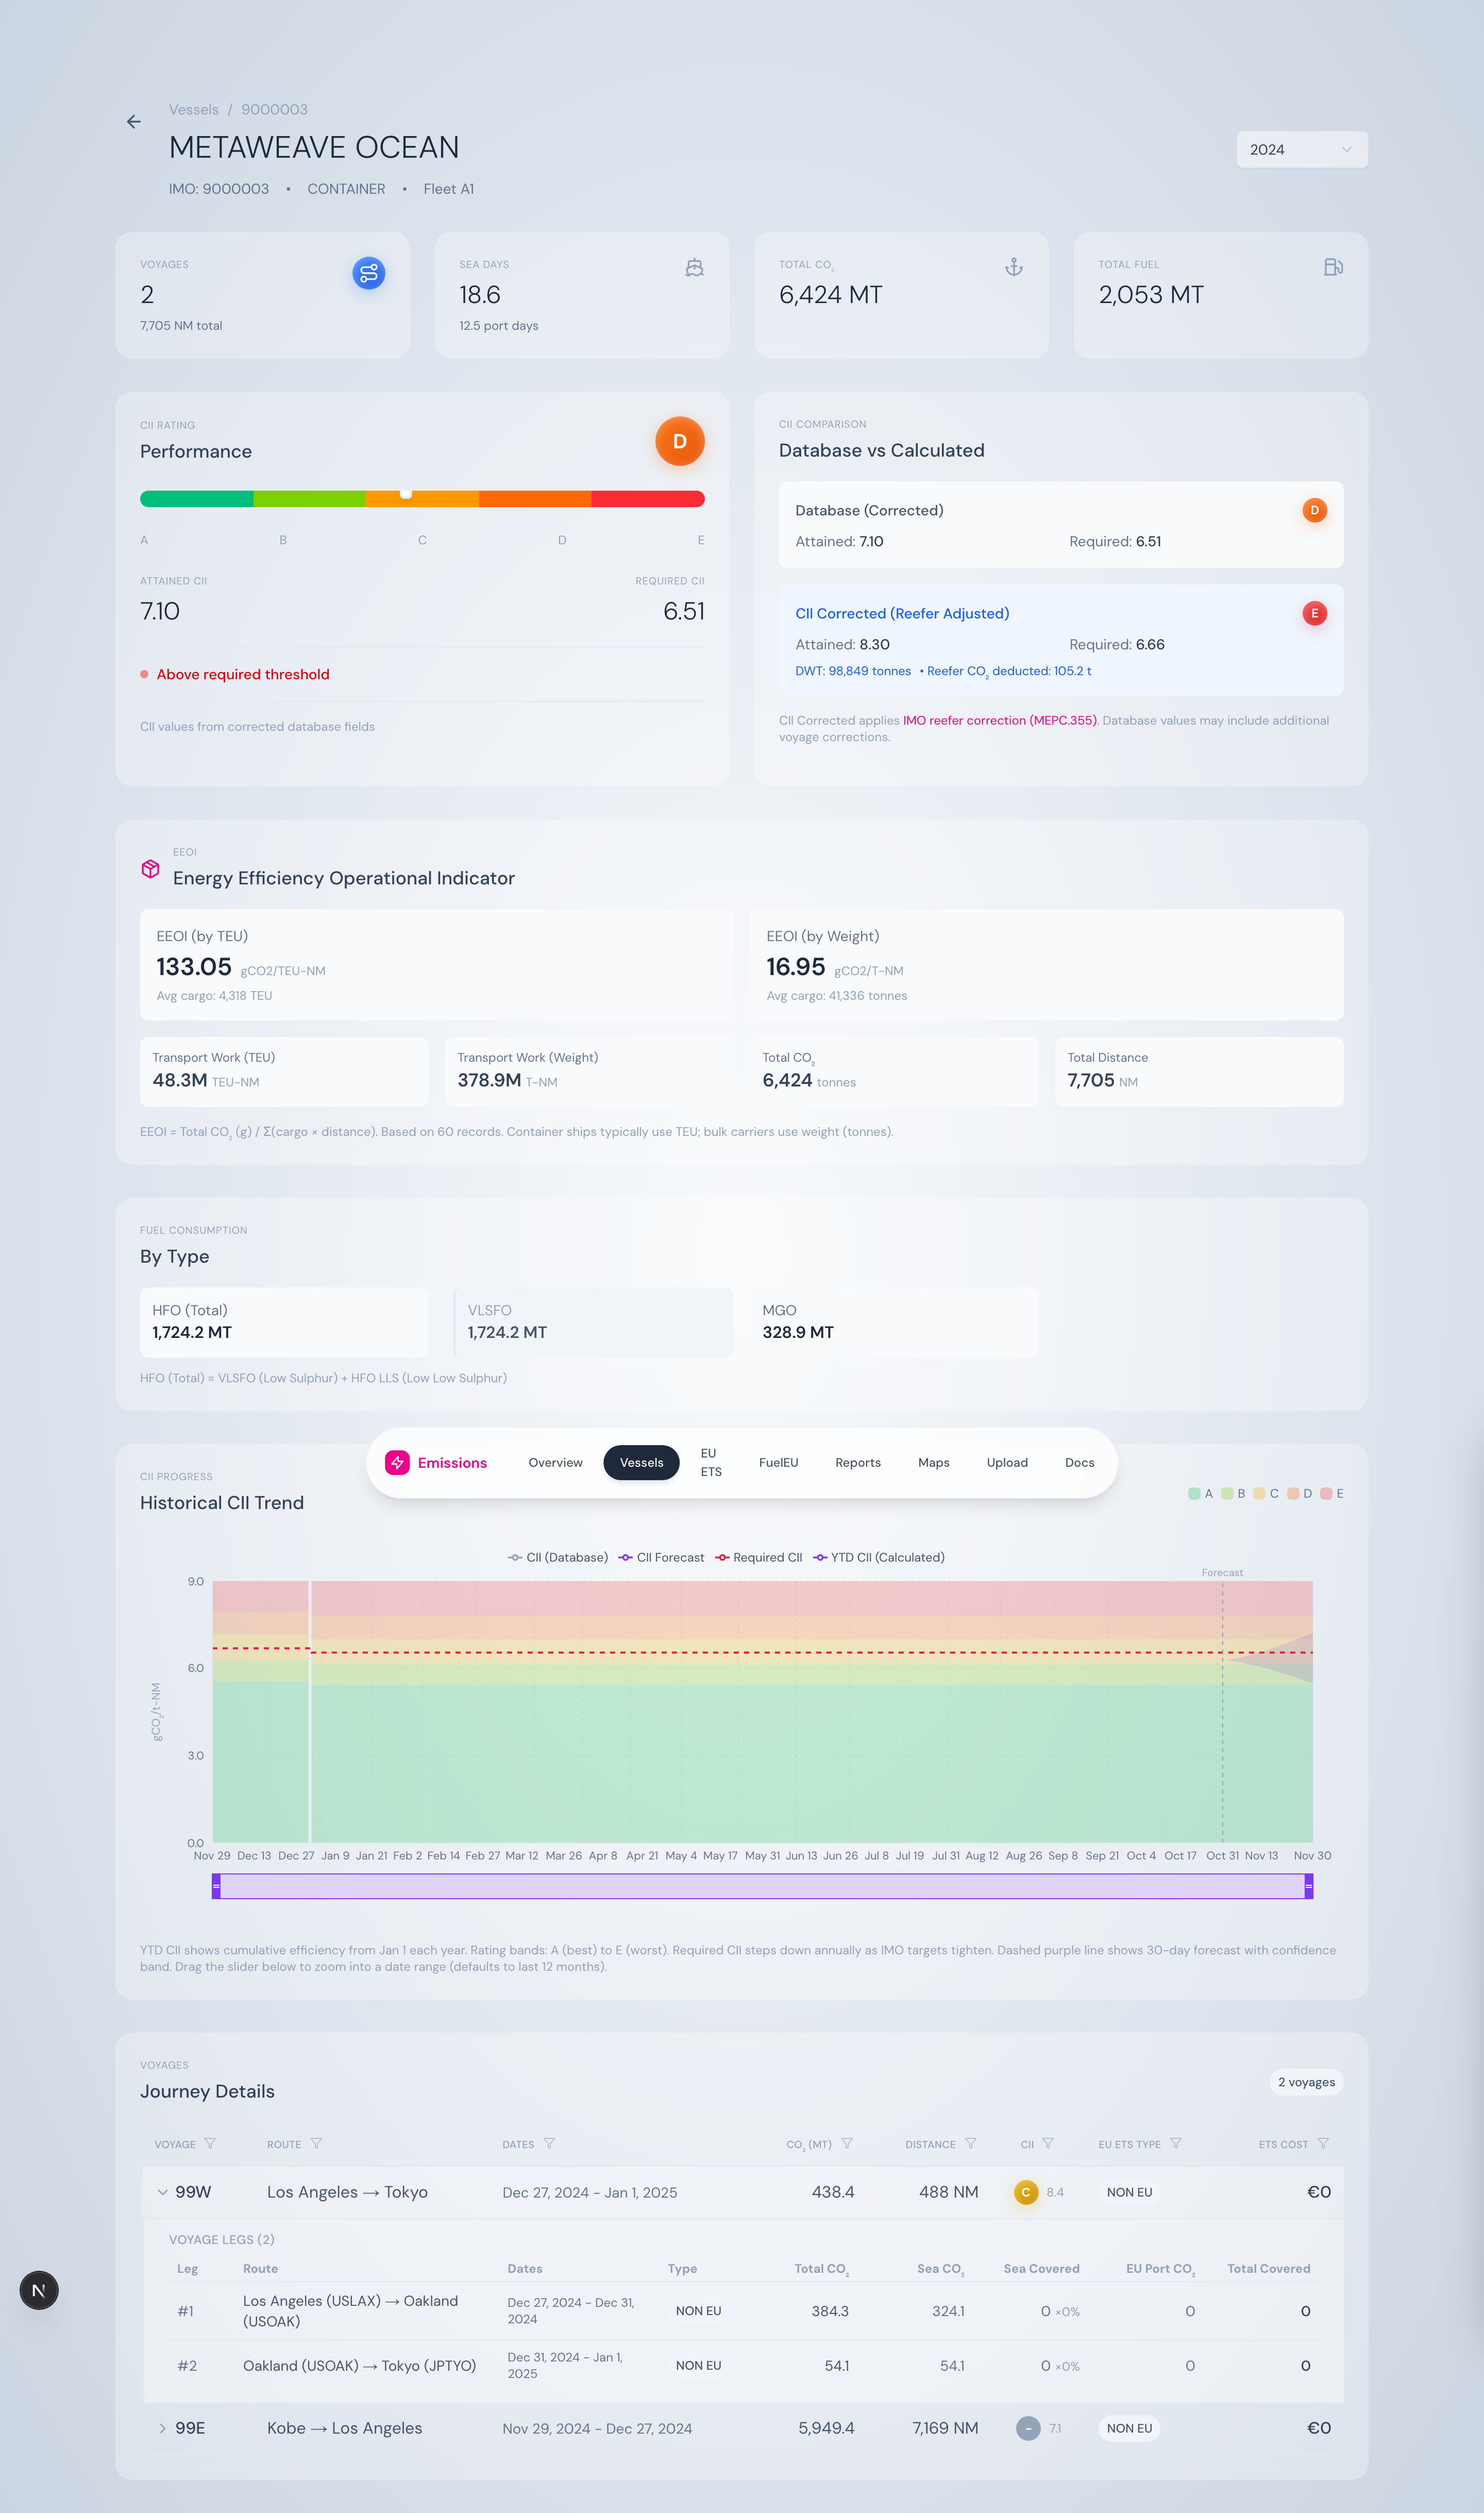
Voyages expand into legs showing covered CO₂ per segment.
-
Check EU ETS exposure
The EU ETS dashboard shows the year’s phase-in factor, voyage classification breakdown, and cost projection at the configured EUA price.
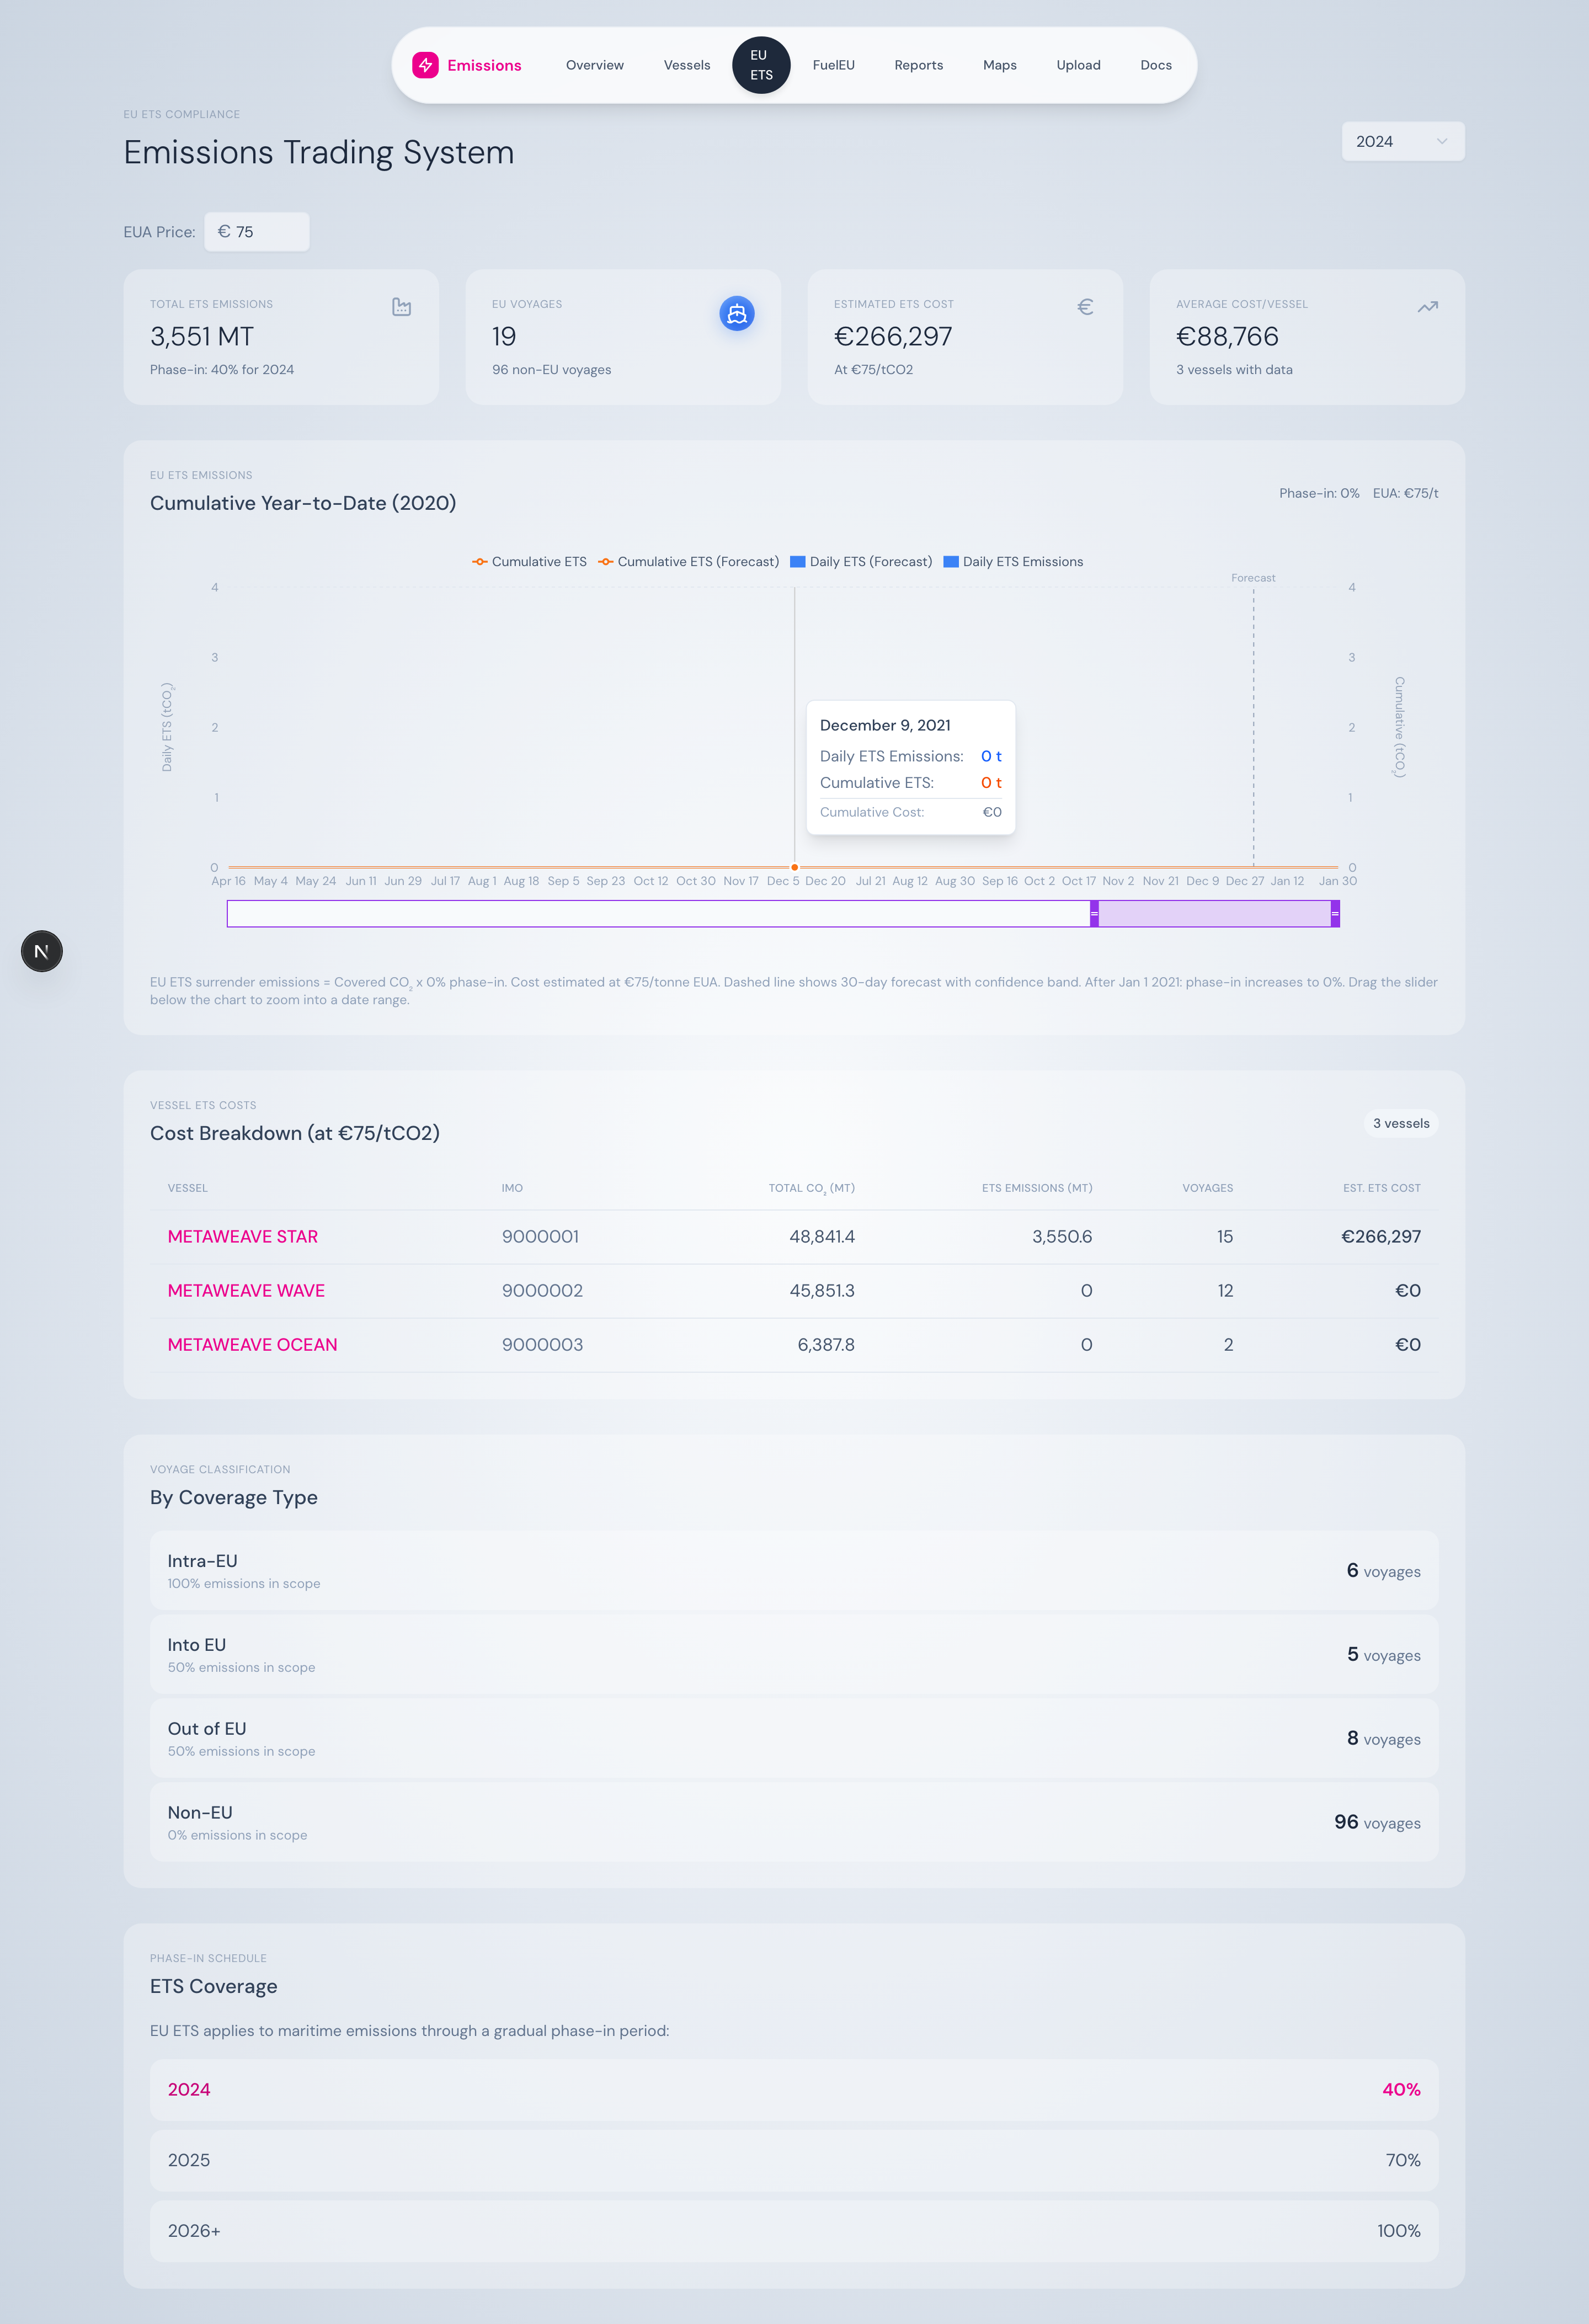
EU ETS — phase-in banner, voyage types, and leg coverage.
-
Generate a report
The Reports hub centralises all five regulatory outputs. Pick a vessel, pick a report, hit download.
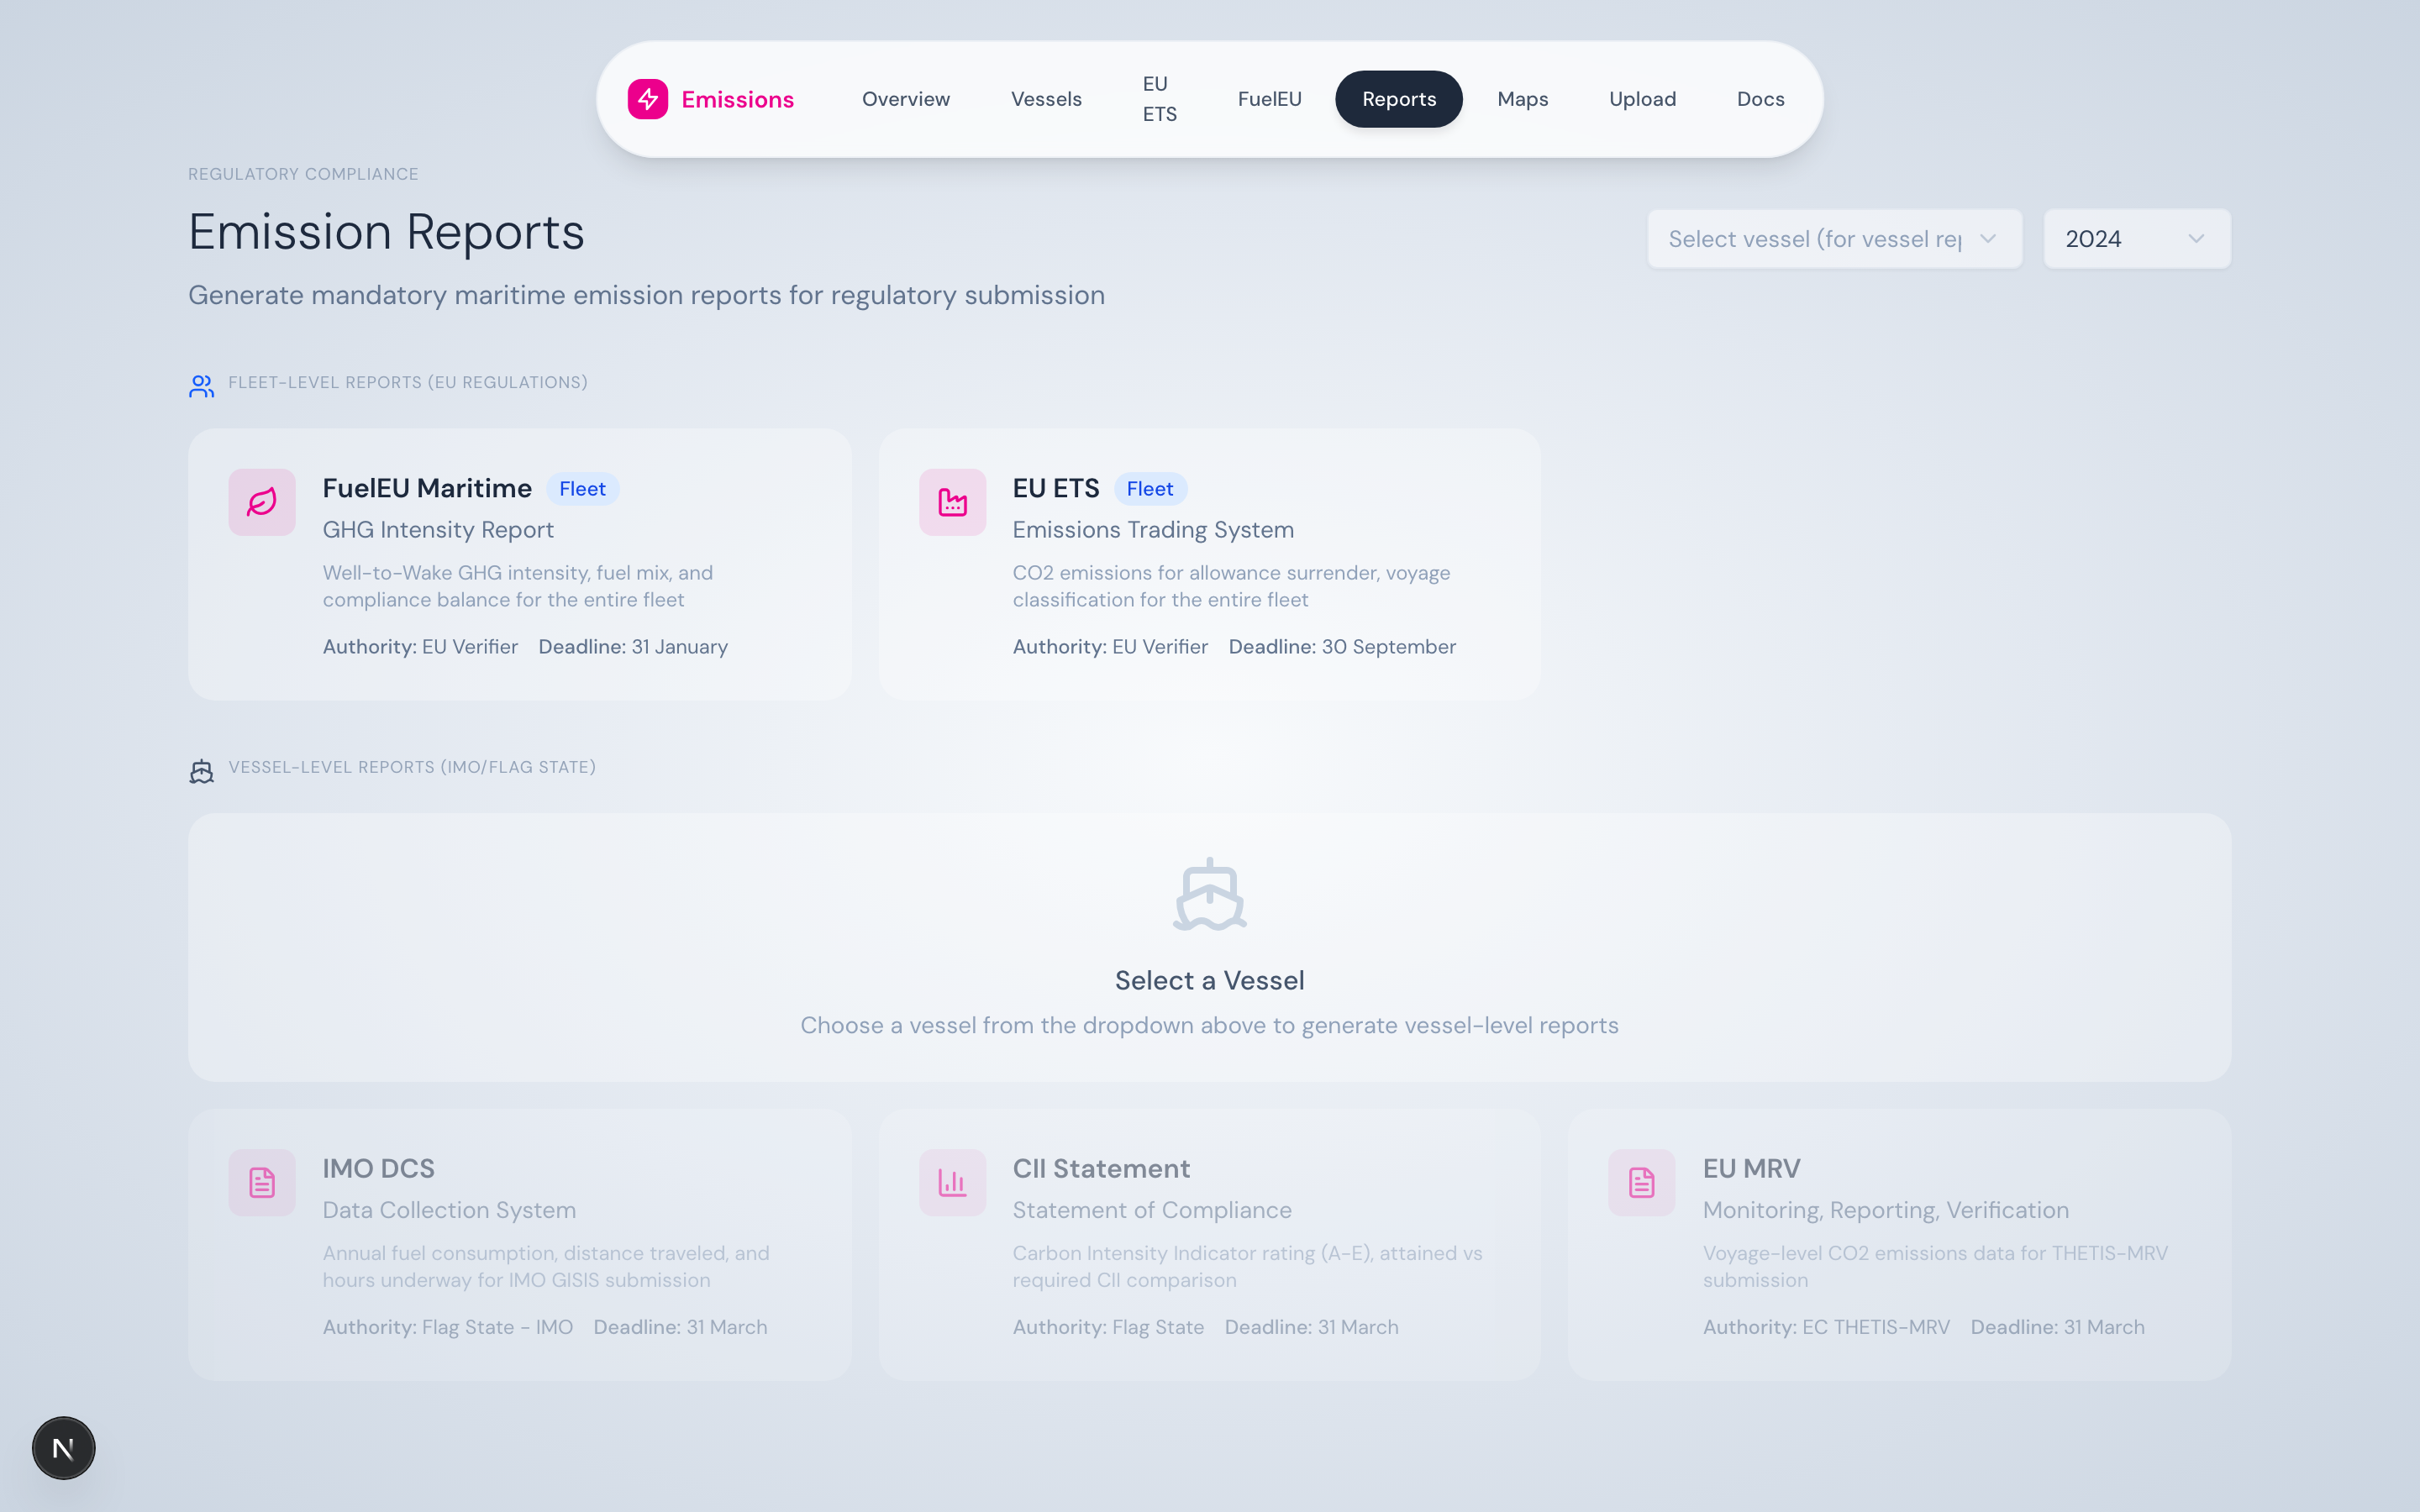
Reports hub — vessel-level and fleet-level reports in one place.